Featured

Assessing Football Management: Did Tony Mowbray do a good job at Blackburn Rovers?

How do you judge a manager?

They get judged practically every minute of every match, and certainly after every match. Either they didn’t make the right substitutions, or the formation wasn’t right or the set pieces didn’t make any sense, but a manager needs to deliver in almost every way to receive a positive mention. Most importantly, they need to deliver three points.

It is a results business. We hear this over and over again, points are the currency by which rewards come in football. Essentially that is what the managers’ primary responsibility is, improving the team’s points won to the extent that improvement can be seen in the league table. The problem is that, in reality, it is not that simple.

What if, for instance, a club runs into financial difficulty? What if the club decides to sell its best footballers? What if a new stadium is planned and constraints on the playing budget are imposed? Dare I say, what if the team are unlucky? Does style of play matter? So, whilst getting points on the board is absolutely important, is judging a manager by results alone a good strategy?

Judging a manager’s talent and ability is something that I, and many other much more well respected football types, find very difficult to do. It is precisely because of the multi-faceted, aspects out of the sphere of control of managers (they aren’t even on the pitch to affect things there) that means that labelling a manager as awful or even outstanding, is often a fool’s game. Except with Steve Kean and Jurgen Klopp/Pep Guardiola. Even Owen Coyle won promotion into the Premier League and has recently won another trophy in the Indian Super League.

Having said that, I would like to investigate a few ideas. 

  • Is the club’s position in the ladder better or worse than when they joined?
  • Does the playing staff look a better group at the end of the tenure?
  • Could the player recruitment be described as over 50% effective?
  • What has the financial management at the club been like in terms of transfer and wage spend?
  • Has there been any infrastructure improvement in the club?
  • Are there any assets left behind that may allow the club to progress at the end of the tenure?
  • What is/has the relationship between the fans and the manager like/been like?
  • Positive performance data

Blackburn Rovers are in the situation where their manager is leaving after just over 5 years in the hot seat. This gives us a really good, large sample to look at a club’s performance during a manager’s tenure and assess the body of work that they have produced.

Tony Mowbray was appointed to succeed Owen Coyle on 22nd February 2017. His first match in charge of Rovers was the next Saturday where Rovers drew 1-1 with Burton Albion in the Championship. 

At this stage allow me to introduce the first couple of areas of investigation: 

Did Blackburn Rovers improve their position in the ladder under Mowbray’s management? 

An obvious yes. At the time of appointment Blackburn Rovers were 23rd in The Championship, Mowbray leaves after guiding them to an 8th place finish.

Then:

Mowbray was initially unable to save Blackburn from relegation from this point, eventually being relegated on goal difference with a points tally of 51. This points total would’ve seen Blackburn finish 19th in 2021/22. Mowbray managed a points per game ratio of 1.47 compared to Owen Coyle’s 0.94 in the opening 31 matches with the same players.

Now:

Mowbray brought Blackburn back into the Championship at the first time of asking, finishing 2nd in League One to Wigan Athletic. He went on to achieve 15th, 11th, 15th placed finishes before finishing in 8th in 2011/2012.

Since promotion back to the Championship Blackburn only once finished a round of fixtures inside the relegation zone (after Week 2 of 2019/20) and they completed over 30 weeks inside the top 6, four of which were inside the top 2 in 2021/22.

Despite this Blackburn Rovers finished each season poorly and were never in with a shout of promotion in the final week of the season.

Does the playing staff look a better group at the end of the tenure?

The starting XI selected by Mowbray for his first match in charge is shown below. 

Added to this XI we must consider other squad members available to Mowbray.

Premier League goalkeeper & Spanish international David Raya was in the squad and was Mowbray’s first choice goalkeeper in League One and then initially in the Championship as well. In retrospect it became a real positive that so many of this squad were out of contract in 2017 as it allowed Mowbray to bring in a fresh set of players alongside the likes of Mulgrew, Lenihan, Nyambe, Graham and Elliott Bennett. However, that is a rebuild that could’ve happened in the Championship given better circumstances.

Comparing the squad he began with to the squad Mowbray worked with this season we can see a massive evolution. Though not obvious in this image, the squad is much younger (proven later on) but also much more depth and tactical flexibility to it. There can be little doubt that this squad is much stronger than when Mowbray took charge.

However, we must also consider what is left behind. There is a lot of red and yellow in the diagram above, those players will not be available to the next manager.

This is the squad that has been left behind by Tony Mowbray. It has been announced today that the Ben Brereton Diaz contact extension has been activated by the club so he has twelve months left on his current deal.

There are some definite depth issues that need to be corrected by the new regime, but the first 11-15 players on the teamsheet here are a) experienced Championship level players and b) many have growth yet to come. Most of the players who have long term deals have a lot of upside and value, with players that are a bit older on short term deals (Ayala & Dack).

There is a lot of flexibility that can be done around this core group of players. If the new manager wants to play a back 4 or back 3, wide forwards or a front two, then that can all be done, with some good recruitment.

There is also a very talented crop of young players in behind. A few are on the graphic, but not mentioned are the likes of Lenni Cirino, Jared Harlock, Jake Batty, Georgie Gent, Charlie Weston, Harrison Wood, and Jordan Eastham. Many others that have a chance of developing into first team squad members as well.

Rovers used the second youngest group of players in the division behind relegated Barnsley. This group has a good chance of developing together given the right circumstances and guidance from a new coaching setup.

The 16/17 squad that Mowbray inherited had an average age 2 years higher and was ranked 14th youngest in the division.

The squad is assessed by Transfermarkt as the 9th highest valued squad in the division. We can take this with a pinch of salt as not all values are accurate but is a decent general guide to where the squad is at in terms of valuable players.

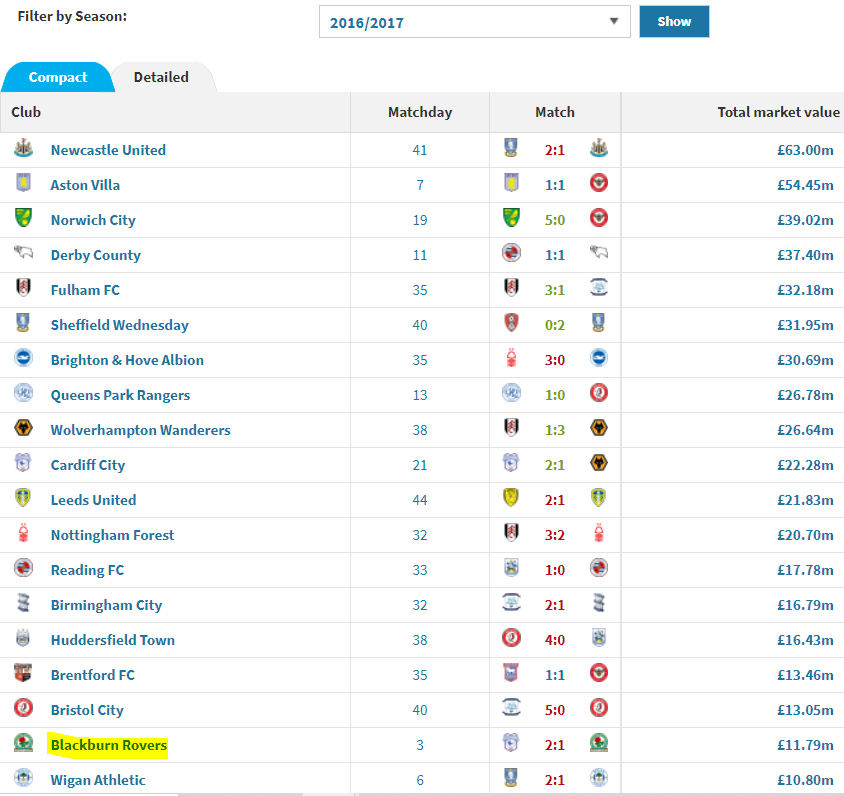
Compare this to where Transfermarkt assessed the squad that Mowbray took over and there is a vast difference. This squad was ranked 18th in the Championship, a full £15m less valuable than the current squad.

So Mowbray passes the first two tests with flying colours. Just taking the squad value and breaking that down slightly, are there any assets within that squad that can allow Blackburn Rovers to progress?

Ben Brereton Diaz is much rumoured to be moving on in the summer. The 22 year old has only twelve months left on his contract and has come to international recognition due to his exploits for Chile in the last year or so. He used that impetus to have his best ever goalscoring season in domestic football, scoring 22 league goals in 2021/22. Some other players who may well attract good money in the transfer market include Academy products John Buckley (now proven at first team level) and 17 year old central defender Ash Phillips. Whilst Mowbray cannot be credited with Phillips’ development, he can be attributed to encouraging the development of the Academy and ensuring that the Category 1 status remained vital to the club during his tenure.

As we have seen, the majority of the players are young and therefore have resale value. Harry Pickering, Scott Wharton, Hayden Carter, Tayo Edun, Lewis Travis, Sam Gallagher, Tyrhys Dolan and countless Academy products provide examples of players that have value for the club. This is in stark contrast to the situation that Mowbray found when he arrived.

However, this is not to say that the recruitment has been infallible. Mowbray did often quote that a manager “lives and dies by their recruitment” and his stock line was that in each transfer window he wanted to “leave the squad in a better place than at the beginning of the window”, which is a pretty vacuous and vague statement, whilst being totally correct.

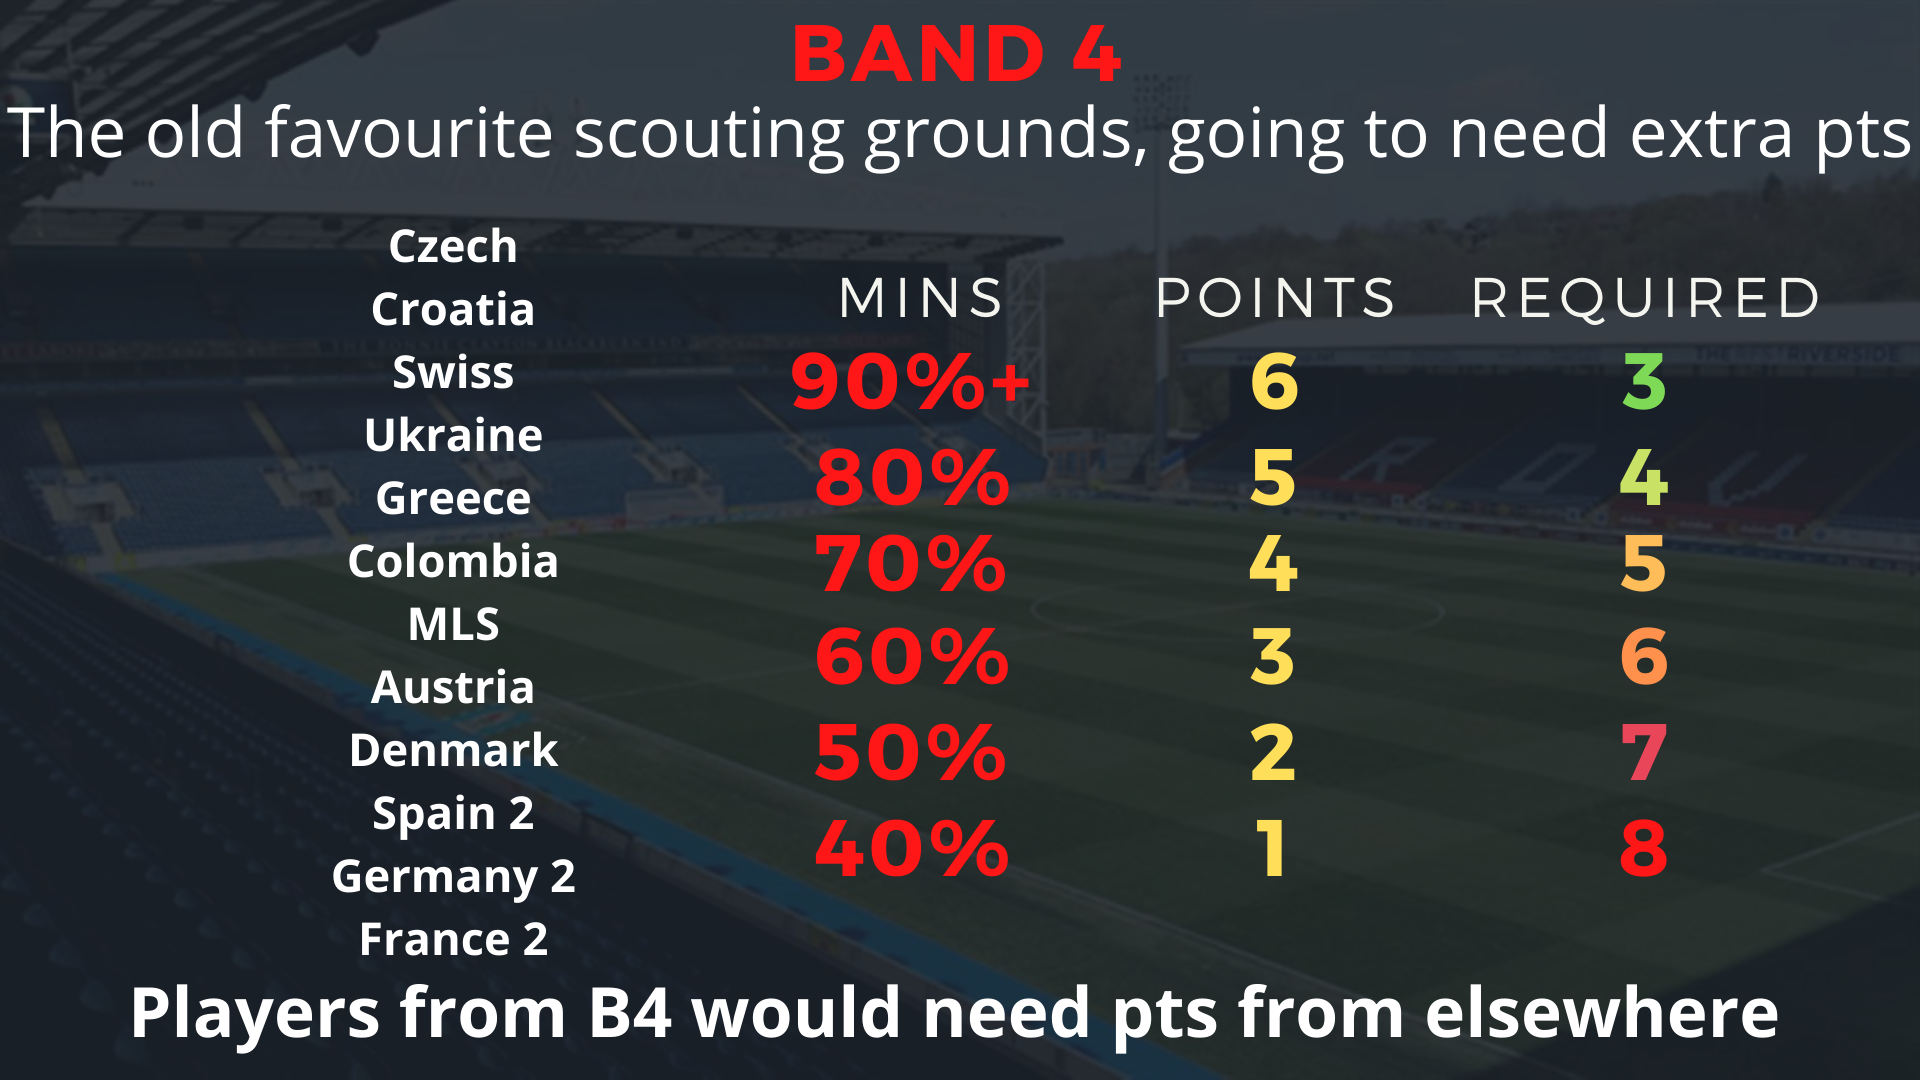
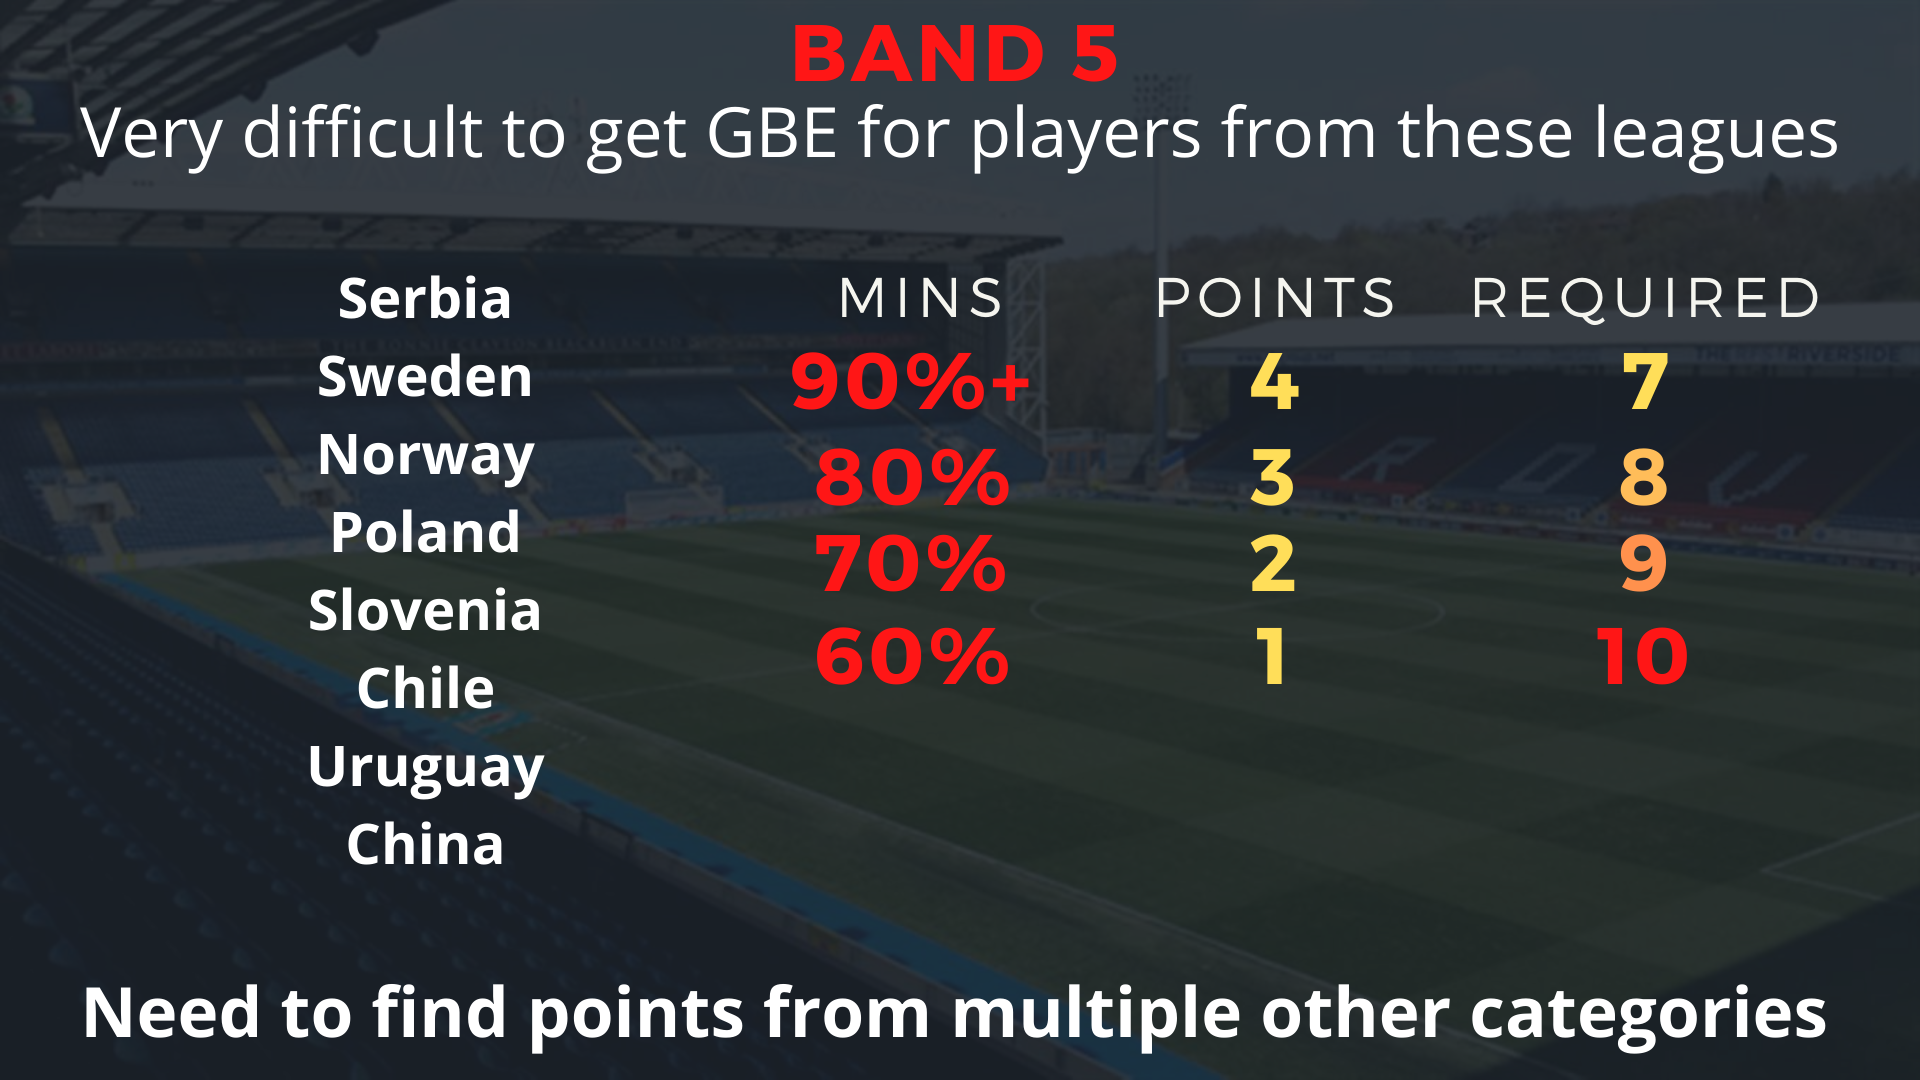
Judging managers on recruitment is often a red herring though in the modern game. In the age of big data and large recruitment teams at clubs recruitment is often out of the managers’ hands, at least until a stage quite far down the road. Also, in a Director of Football/Head Coach model, recruitment may be almost totally out of the head coach’s hands and his job is to deal with the hand that they are given.

However, it is of huge importance (in my opinion) that the manager/head coach works closely with the recruitment team to ensure that the team fully understands their principles of play and their assessment of the current squad. This way there is little wastage of time and also ensures that the players shortlisted for a transfer window are (hopefully) of the right type to improve the squad that the coach can work with.

So, could the player recruitment at Blackburn under Mowbray be described as over 50% effective?

Why 50%? Dr. Ian Graham of Liverpool gave a presentation at the Statsbomb Conference in 2021 discussing how how many factors build into transfers in football. With all the complications, getting over half of them ‘right’ is a pretty useful ratio.

Forgive me, but there is an element of subjectivity to this measure in this instance. Whilst I would love to have the time to build an effective model to independently assess the success of transfers (and I have given plenty of thought as to how this would look) I simply don’t have the time to make this work right now.

So, taking into account a number of factors, but principally:

  • Percentage of minutes played
  • Impact on results
  • Impact on performances
  • Resale value
  • Profit or loss made on transfer fee
  • Value for wages
  • Fan connection

Taking all transfers into account and judging each one as an absolute success or failure, I came down on the following:

The full list of who were judged successes and failures are at the bottom of the blog as an appendix in case you want to disagree!

Mowbray just about hits the 50% that Ian Graham suggested for all transfers, and just below on the permanent ones. Of course, this lacks context, a couple of the signings have been magnificent. Bradley Dack is the archetypal example of this. A player signed for £750k that was due to be sold for £10m+ before his terrible injuries. Adam Armstrong turned a near £10m profit for the club and Ben Brereton Diaz looks like he may do similarly this summer. Many of the signings included in the sample were for young players who were small risks and really shouldn’t be weighted the same as the senior transfers.

It hasn’t all been sunshine and roses however. Daniel Ayala’s transfer hasn’t worked out at all and he continues to be under contract at the club taking a big wage. Lewis Holtby can be filed under a similar heading. Meanwhile, players like Sam Hart, Brad Lyons, Mitch Candlin, and Antonis Stergiakis haven’t made an impact on the first team.

Overall, it is a net positive for Mowbray that in his tenure the recruitment has concentrated on young players with potential resale value and/or that provide a lot of service for the club. 

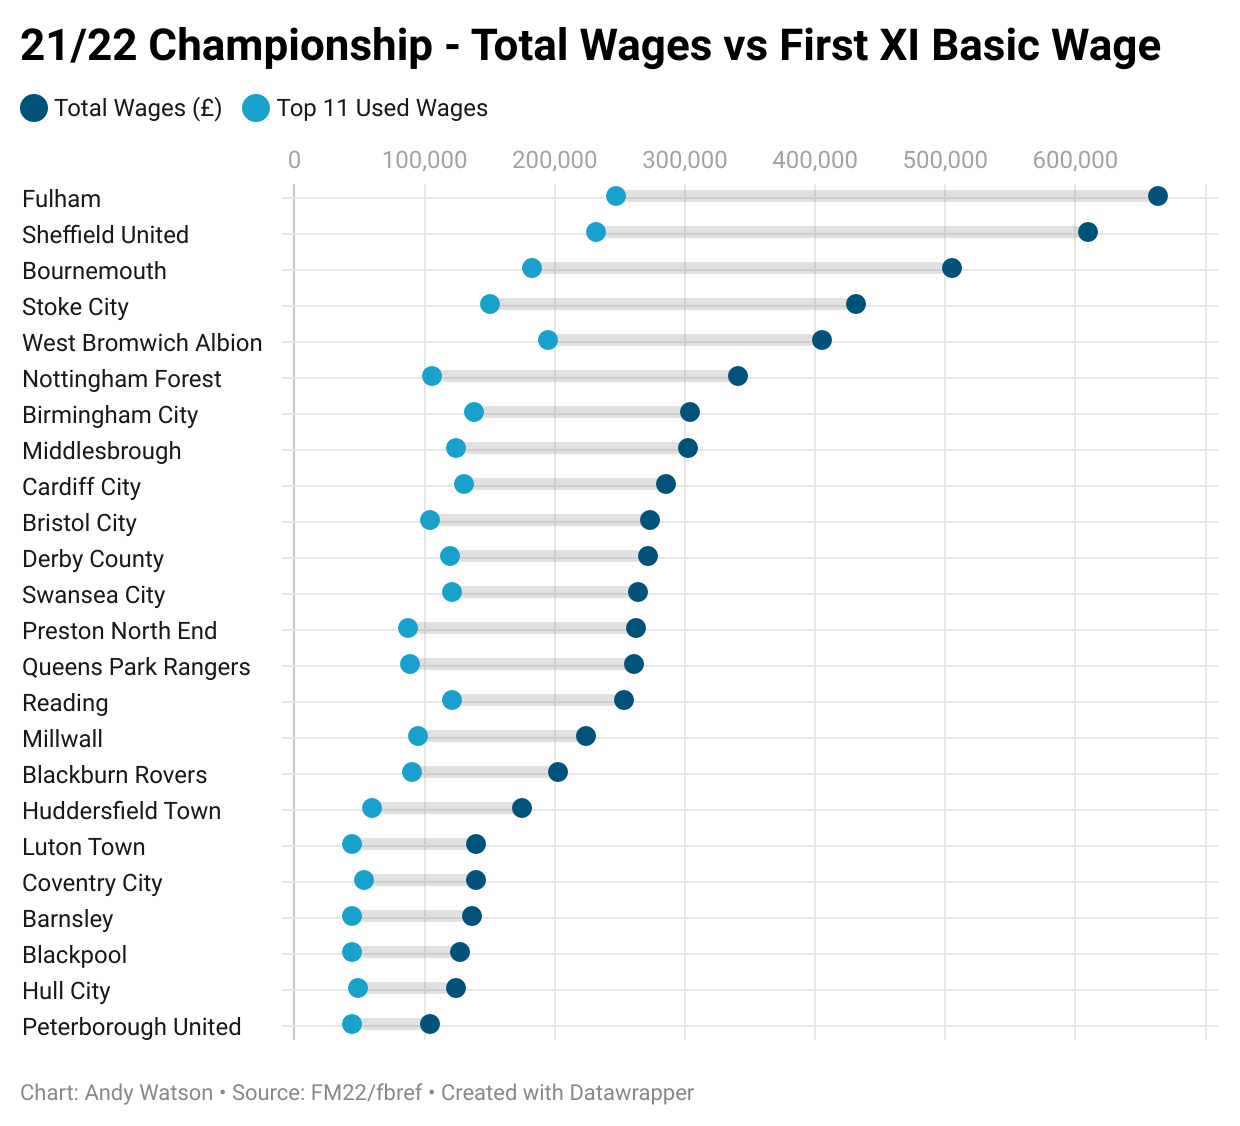
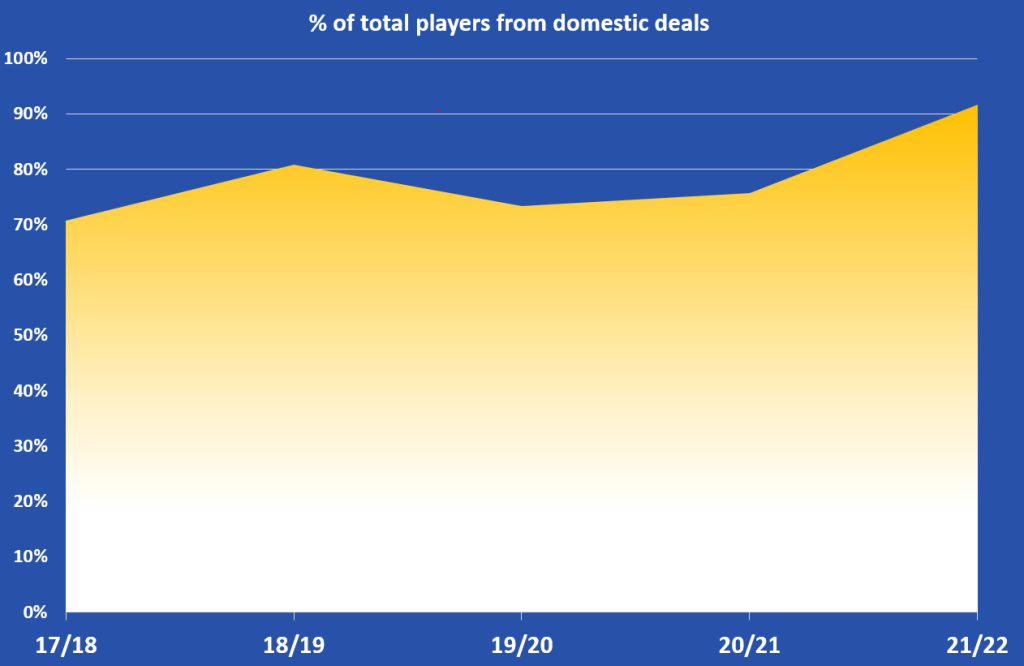
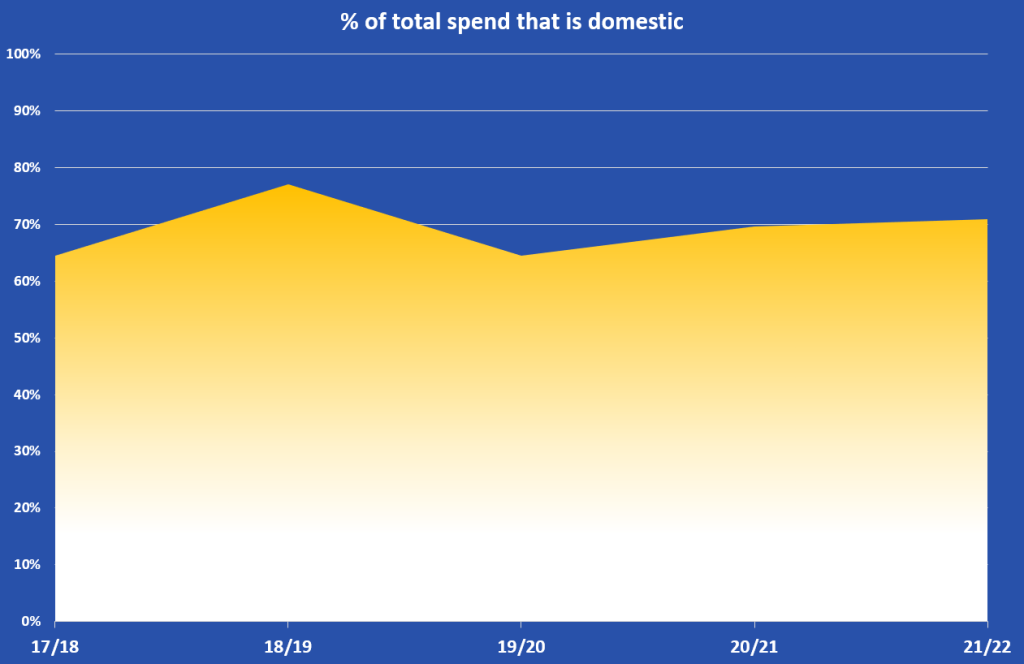
Of course, recruitment would’ve looked a lot different if the financial situation at the club was a lot different. FFP rules have constrained Blackburn with how much they can spend in transfer fees and wages to the extent that they have very much a bottom half budget for the Championship. This is proven by financial statements going back from the latest release for 2020/21 back through the last few years.

In terms of what the manager has some effect on, has the financial management in terms of transfer fees and wages spent been prudent?

It’s never that easy to judge financial data, especially within football. For the most part we have to rely upon “best guess” information, Football Manager data and calculations from the submissions to Companies House.

In Mowbray’s five-year tenure we have financial data from all years via submissions to Companies House. I have taken some of the key points from the Mowbray reign and summarised them in the following table.

Mowbray was powerless to prevent the losses increasing year-on-year for Blackburn Rovers. In reality, no manager could make much of a dent in a multi-million pound issue. However, the wage increase since he took charge is sitting at around 17%, not an insubtantial increase. 

Also, in this time, the board sanctioned a couple of big-money fees for forwards Ben Brereton and Sam Gallagher. At the moment the Brereton deal in particular looks wise with a potential £10million+ fee being asked for his service, but also, with Gallagher signing a long term extension to his deal he is likely to provide a big service to the club and his performances, whilst inconsistent, are still important to the club.

Rovers have been able to manage the balance between debtors and creditors quite well over the Mowbray reign. It does look as though money generated through sales has been poor, but when you look at the squad inherited by Mowbray it was clear that it was going to take a while to develop talent that was actually worth anything. The sale of Adam Armstrong isn’t yet represented in these figures, but that clearly will make a big difference to the balance of money spent to money earned in player trading. A Brereton Diaz sale would do the same.

The year on year losses are bad, but mostly out of the control of the manager. The losses also highlight how the manager had to work within those means. The recruitment looks better than the bare numbers when considering the financial difficulties.

Just looking briefly into the squad wages that are not covered in the above financial accounts, over the summer of 2021 a lot of experienced and high earning players left the club. They were generally replaced by young players and loan signings. This meant that the squad actually cost less by wages paid. And yet, the improvement has continued for the club.

Data from Football Manager 2022

In essence, Mowbray has elicited the improvement in the league position in a highly competitive division whilst reducing the first team wage budget and, thanks mainly to the purchase and sale of Adam Armstrong, spending very little on player trading.

This prudent management has been an attempt to keep costs down but the owners have still had to continue to pump money into the club, as well as sell the training facility to themselves, to keep the wolves from the door. Again, this probably reflects well on the manager that such a situation didn’t seem to affect his work or the team’s performances (aside from the obvious part of having less quality on the pitch).

However, this has also meant that the infrastructure of the club hasn’t seen much, if any, renewal under Mowbray’s tenure. The stadium is beginning to feel dilapidated, the training grounds, though still good and able to sustain a senior team and a Category 1 Academy, has work that could be done. Realistically though, only a promotion into the Premier League would go any way to solving these problems.

Ultimately, this is something that Tony Mowbray did not come particularly close to achieving. This is where the frustrations often lie with the fan base. Mowbray has become famous on the messageboards and on social media for his “death spirals”. The actual statistics below set out the stark reality of Mowbray’s reign and the drop off in results in the second half of the season.

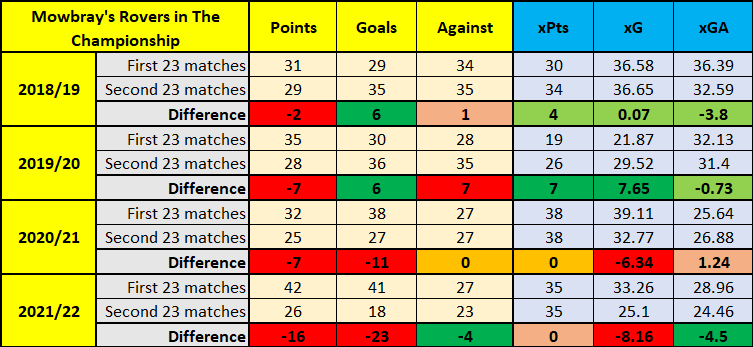
The hardest thing to try and do is to analyse where it has been going wrong for Mowbray. The points totals have been falling away, and in the last two seasons it has been a real decrease in goals scored that has been the issue. Chances created have fallen away as well, though not as steeply as the goals themselves.

Interestingly, these Mowbray teams have never dropped off in terms of expected points. So whilst the goals do dry up, the chances the team concedes also tend to reduce and therefore matches are more narrow in their expected outcomes. Therefore it only takes a mistake or luck to go against you to turn a positive result into a negative one. There’s also the point that in 19/20 and 21/22 the team massively overperformed their xPts and a reversion to the mean in those cases were to be expected.

Season 21/22 will definitely be the most painful of the falls because of the position that the club found themselves in. In January it would actually have taken a record poor effort for Rovers to miss out on the playoffs. To not even be in with a shout by the final day must be very painful for all concerned.

So what of the relationship between the manager and the fanbase?

The relationship between Mowbray and the Blackburn fans has never reached the point where he lost the support of all the fans, or perhaps even the majority of the stadium-going fans, but there have been definite tensions with the fanbase on numerous occasions about his leadership of the team.

On many occasions the #mowbrayout has been seen and when the club goes 15 matches without a win, displays relegation form for a sustained period of time to drop from automatic promotion to outside the playoffs and sustains it’s biggest ever home defeat then perhaps this is understandable. Indeed, that long winless run came when fans were not allowed in stadiums. Had this not been the case then there may well have been a lot more pressure put on the decision makers to review the managerial situation.

There is also a thought that Mowbray’s demeanour in press conferences and interviews has worked against him in his relationship with the fans. Whilst I don’t subscribe to that theory myself I can understand the frustrations of some fans with this.

It would appear though that upon his departure there is a feeling of gratitude amongst most fans for Mowbray’s service to the club for over 5 years. Most agree that he is a good man with integrity and morals that has represented the club in the right way. Some are glad to see the back of him as well of course as is the nature of a fan base and, indeed, of social media.

It wouldn’t be an Andy Watson blog post without finishing with some data. Whilst points are the currency of football and points make prizes they are not always the best way of measuring improvement.

Using expected goals as a measure we are able to track Rovers’ performances since their return to the Championship and establish their xG for and against over that period on a rolling average. 

The overall trend is one of defensive improvement. From conceding over 1.5xG per 90 in the first season back in the Championship, Blackburn ended Mowbray’s reign conceding fewer than 1xG per 90.

The chance creation suffered on average though. There were some spikes of immense chance creation, usually at the beginning of seasons, but also a couple of periods of real struggles in creating chances. 

We are also able to compare the xG difference to the actual goal difference over the different seasons to see how much the team over/under performed with their points won against chances created.

This chart really does demonstrate the improvement over time really well. Showing the xG difference alongside the goal difference proves that the increase, especially over the last two seasons is not a fluke.

The improvement has slowed somewhat towards the end of Mowbray’s reign, and ultimately, may well be part of the reason why we see the parting of the ways now.

Certainly looking at this chart, it does appear to be a good way of viewing a manager’s reign in totality.

Overall Conclusions

Some may think that this whole blog post is a bit mad. A manager is judged good or bad based upon how successful they are. The problem is that everyone has their own opinion and judgement on what that means to them. 

Some Rovers fans will say Mowbray will never take Blackburn Rovers to the Premier League, therefore he needs to be replaced. Some will say that he’s done a good job and should stay. The trouble, of course, is that those judgement calls are not mutually exclusive and I daresay that a lot of Rovers fans believe both of those statements to be true, i.e. Mowbray has done a good job but isn’t the man to lead the club back to the Premier League.

What I have attempted to do, using Mowbray and Blackburn as a case study, is to come up with some rules or brackets by which we can apply some kind of measurement to how well or badly a club has performed under a manager.

In Tony Mowbray’s case, these rules suggest that he has been a successful manager for Blackburn Rovers:

Is the club’s position in the ladder better or worse than when they joined? Tick
Does the playing staff look a better group at the end of the tenure? Tick
Could the player recruitment be described as over 50% effective? Average
What has the financial management at the club been like in terms of transfer and wage spend? Good
Has there been any infrastructure improvement in the club? Average
Are there any assets left behind that may allow the club to progress at the end of the tenure? Tick
What is/has the relationship between the fans and the manager like/been like? Average
Positive performance data Latterly, tick

Worryingly though I am still not sure it helps me assess how good a manager really is and it certainly doesn’t help to predict how successful they will be in future. I think that the fit and the circumstances between a manager and the club that they are in are totally unique and some things are just not applicable from job to job.

However, what I would say is that if a club were looking to employ Tony Mowbray in future then they can be satisfied that the job he did at Blackburn Rovers was one of competency, financial prudence and good sense.

If anyone would like a similar study done on their manager or on a manager of their choosing please get in touch.

Appendix

Featured

Recruitment on a Shoestring: Adapting Metrics – Expected Assists

Your Director of Football/Manager comes to you and says, “We are looking for a creative central midfielder. Someone who can supply our forward players with goalscoring opportunities. Build us a shortlist to have a look at please. Oh, and we want it by close of play today,”

Your budget is small. Your team of staff is practically non-existent. Your time is limited. What can you do quickly to produce some quality, reliable results?

As I showed in my last blog post, having a system that is wide-ranging but also specific and quick to produce results is ideal. The AWRSS is a useful tool but, again, as I state in the article, is continuously open to improvement.

If I use AWRSS to bring back the top 10 central midfielders in the Premier League who have the role of “attacking playmaker” and set the minimum minutes played to 1000 to weed out the small sample sizes, these are the players that are returned from the 21/22 Premier League season:

As a group of central midfielders go, I would say that’s a pretty creative selection. Hojbjerg is a surprising one, but I would expect to see most of the names on that list. What is most striking about the list though is that Manchester City and Chelsea dominate. Seven of the top ten players are from those two clubs.

The attacking playmaker role is made up of:

  • Composure
  • Decisions (on the ball)
  • Goal contributions
  • Pass delivery
  • Passes through the lines
  • Progressive passing
  • Quality final action
  • Quality touches on the ball

The good thing about the AWRSS is that it doesn’t rely solely upon one metric or even half a dozen metrics to try and assess a player in a role. There are over 20 Wyscout metrics that are melded together within the attributes above in a way that when weighted to the design of the end user create the final scores. The way that I have weighted attacking playmakers has produced the PL list above.

It is clear that Manchester City and Chelsea have developed a system of play that promotes the values of those listed in the description of an attacking playmaker within their central midfielders. Therefore, the value of the list is somewhat diminished by the extreme bias of the top teams and the tactics used. Rodri and Jorginho are perhaps not the best attacking playmakers if they were playing for other teams.

Not only that but if this were a list that I presented to my DoF or Manager, unless I was Real Madrid or Barcelona, I would be totally laughed out of town. The special sauce is to be found digging underneath the obvious and finding value in the data where others may not be able to search or think to search as readily.

Adaptation of the data

There are certain calculations that can easily be made that bring some adaptation to the data.

The first thing that I thought of that would apply more context would be to use actions per 100 passes.

To demonstrate how this might work I have taken one metric that comes up in a couple of the key attributes in a creative central midfielder, xA.

For the unacquainted, xA stands for expected assists and is basically a derivative of the more well known expected goals (xG) metric. xA is an attempt to give some credit to the passes provided for chances, even if they don’t result in goals, after all it isn’t the passers’ fault if they supply a gilt-edged chance for a player and they make a total mess of it.

So looking at xA within our cohort, Premier League central midfielders, Wyscout gives us a total xA for each player and a xA per 90 figure. Let’s start by taking a look at this figure in isolation.

This is for all central midfielders in the cohort, but as before, I want to weed out some of the small sample sizes. Again, I have removed players who had played less than 1000 minutes at the time the data was taken, the results are displayed below.

Ignoring the fact that most of these players tend to play more advanced than central midfield, we still have the situation in which six of the players are from “Big Six” clubs. We also encounter a new problem here too, looking at the players in the top ten expected assisters there are a lot of players here who are the main deliverers of set pieces for their clubs.

In the interests of trying to find value for our employers then it is of interest to look outside the pre-made and widely distributed metrics. In other words, use what we have and design some bespoke metrics. Set piece takers and midfielders from dominant clubs are easy to identify but lets begin investigating a few options

xA per 100 passes

By using the number of passes played by a player as our context we are able to negate the dominance of certain teams. In essence, we are limiting the players to 100 passes and seeing what they have been able to create. Of course, this means that these central midfielders still need to be in a position to play the key passes that create goalscoring opportunities though.

From the results above it is clear that we have shifted the goalposts quite substantially. There are no Manchester City players now in the list, only three players represent “Big Six” clubs and no club is in the top ten more than once.

The value given by John McGinn at Villa over this season is highlighted very strongly here and, interestingly, Adama Traore’s Wolves performances perhaps need re-appraising.

The narrative on Traore in England was that his final action was a massive let down. Yes, his bottom line figures of goals and assists were probably below what was expected at Wolves, but his expected assists per 100 passes in the Premier League is actually exceptional, according to Wyscout data. Of course, he is not the type of player to play many passes, esepcially not in the midfield areas. His 4 assists in a Barcelona shirt in 400 minutes, though a small sample, suggests that he perhaps isn’t the lost cause in the final third that many have portrayed over the years in England.

We do still notice that set piece takers make a big dent in this top list though. When a potential 15-20 of your 100 passes are guaranteed to go directly into the penalty area without pressure and with numerous targets to aim for then it is unsurprising that so many show up here.

Wyscout doesn’t give the user the option to automatically filter out set-pieces but I am working on a proxy which will be the subject of another article.

xA within context of team possession

Working on a similar basis of the 100 pass idea, in this case the xA per 90 metric is divided in the ratio of their team’s possession over the course of the season. The idea behind this is that the players that don’t play in teams that give them the opportunity to play those xA types of pass as often as say Chelsea and Manchester City players.

The names are almost exactly the same as in the per 100 pass list, except in a slightly different order. Ashley Westwood certainly benefits from Burnley’s low possession style, again this will be because of the number of set pieces he delivers into the box.

Bruno Fernandes being so high on the list perhaps says more about United’s reliance on him as a creative force than anything else.

This is an interesting metric but I would suggest that both per 100 passes and possession share do a similar job. This needs to be tested on wider cohorts to tease out further information.

xA within context of team xG

If your team doesn’t create many chances should that be put down the individuals on that team or the manager? I guess this is down to opinion but it could be worth adapting the xA metric to work a bit harder by putting it up against the team xG value. This should provide an indication as to which players are creating goalscoring opportunities within their teams.

With the way that this is calculated it is unlikely to get many players from the same team in the top performers. The players listed above represent the key chance creators for their clubs.

Once again, this translates as a fairly accurate list of Premier League club’s set piece takers. If you were Burnley’s set piece taker and didn’t show up on this list of xA as proportional to team xg then something would be going wrong.

This means that if we are to find some better use of this metric then we either need to dig deeper into the cohort or find a way to reduce the influence of set pieces using the data we have.

What’s the relationship between these metrics? Is it worthwhile looking at them?

Having gone through the process of calculating these adapted metrics it is worthwhile asking if it is worth it.

After all, we have seen through the article that the same names tend to come up in the top ten results and also there is a lot of infiltration of set-piece takers that are difficult to get rid of from the Wyscout data. 

The table below demonstrates how closely related the new metrics are to the original  xA. This suggests that basically if you can’t be bothered to adjust metrics and do some calculations then, in most cases, the xA per 90 is a fair measure to use. 

The co-efficient of determination is a measure is basically the measure of how much of a relationship can be explained by the other attribute i.e. How much xA per 100 passes can be explained by xA per 90.

In this case, with PL central midfielders, 84% of xA per 100 passes can be explained by the normal xA metric. So they are tremendously similar…

…BUT we now live in a world in which the phrase “marginal gains” is all important. The 16% difference in the metrics may well be where a club can find a player of value that may be missed by others. This is the essence of ‘Recruitment on a Shoestring’.

The same also goes for the 12.5% difference in xA by possession ratio and the 15% in xA vs Team xG. Whilst the area of difference may not be quite so large to search in there will be slight differences in the players that show up as impressive performers.

Visualisation

To illustrate this point more easily I have produced some scatter diagrams that help visualise it. Firstly, taking the xA per 100 passes example, we already saw John McGinn and Adama Traore show up in the top 10 examples of this but this diagram highlights players further down the list that impress more in this metric than the xA per 90 standard.

Any player that is seen below the trend line is one that has a better record per 100 passes than per 90 minutes. Conor Gallagher from Crystal Palace, Rodrigo of Leeds, Douglas Luiz, Moussa Sissoko and even Leander Dendoncker and Josh Brownhill perhaps need to have their xA upgraded when taking into account the number of passes in which they create chances from.

Some creative talents that are served slightly better and worth investigating based upon the lack of possession that they get are the likes of Youri Tielemans, Douglas Luiz, Jonjo Shelvey and even perhaps Billy Gilmour. Again, the spectre of regular set-piece takers rears it’s head here though.

There are some stand out differences in this cohort when taking Team xG into account. Understandably some Norwich players come out of this quite well, with Pierre Lees-Melou standing out as a player who has actually created a few chances amongst Norwich’s paltry overall xG. Joao Moutinho’s efforts for Wolves also get a bit of a boost when looking at the stats through this lens.

Overall Conclusions, Uses & Next Steps

In a world in which data is being used ever more frequently and Wyscout is a well used tool it is clear that personalising the data and metrics is one way of staying ahead of the crowd. Recruitment on a Shoestring depends upon finding different ways to find talent outside of the mainstream.

The single example used in this article of xA amongst Premier League Central Midfielders did highlight a few different players from the obvious. However, applying this to a wider context would obviously yield a better variety of results and undoubtedly a selection of interesting players to look further into.

For example, a League 2 club looking for options in the National League would be a good case study for this. A player such as Ruben Rodrigues of Notts County ranks highly in xA, but is well known & highly coveted. So using the different derivations as calculated here should bring up some interesting alternatives with less of a queue.

The question of whether it is worthwhile depends on the time available in your recruitment department. As we calculated, there are 80-90% similarity between xA per 90 and the derivative measures. But is that extra % where the gold is to be found?

In the preparation of the AWRSS I highlighted some metrics that I felt needed to be adjusted for quality & possession. I intend to fold these metrics into my AWRSS system over time and allow those figures to be choices that an end user could make to see which players warrant shortlisting.

The biggest stumbling block in this particular metric of xA is that many of the names that we found were ones of set piece takers.

Therefore, the logical next step in my ‘Recruitment On A Shoestring’ series is to work out how to make this less of an issue and improve this aspect of the system.

Featured

‘Recruitment On A Shoestring’: A series on How To Get The Most Out Of Your Recruitment Budget

When I think about the current situation in football recruitment I certainly see a lot of change.

The ‘traditional’ system of having an extensive scouting network of former players in stadiums watching matches ad hoc is still found all over the country and, indeed, the world. The network of contacts, ex-teammates, and agents still continues to provide for many recruitment departments out there.

However, the tide of data and recruitment analysis and machine learning has changed the whole landscape.

The pace of change at the top of the game is lightning. The growth and development of analytics companies, as highlighted by Ted Knutson’s recent tweet on his own Statsbomb company.

https://twitter.com/mixedknuts/status/1498711516249563145?t=AA9EwSrbii2V0PI1SYHT7A&s=19

Many clubs are allocating budget to analysis in recruitment. Also in analysis of performance and opposition. But for every Liverpool, Manchester City, and Brentford, there are still tens & hundreds of clubs that either have data but don’t know how to use it or don’t think that they have the budget to spare to invest in recruitment analysis.

Enter this series.

All of the work that I currently do as an analyst uses only myself & a basic bronze Wyscout account (£200 annually) as expenses.

This is how I developed my AWRSS. Obviously the amount of work that went into this system means that this is a great starting point for recruitment & one that I believe would already be a step forwards for many clubs around the world.

Through this series I hope to be able to demonstrate that by using only free and inexpensive tools and a little bit of ingenuity, sensible processes, a clear vision, and time, that the value provided is worth it, regardless of budget. In essence, it’s what you do with the information you have that can make the difference.

As a bonus to readers I will be able to drop info on lower league football, non-league football and some interesting foreign markets. But the main aim is to show how good processes are adaptable across the whole football landscape.

And yes, for any club, at any level.

Please get in touch if you want to speak to me directly about my work.

Featured

AW Role Scouting System: The Launch

Football used to be simple. It was to me as well: You were either a good full-back or a good central midfielder, or perhaps a defensive midfielder or attacking midfielder. But when you look closer that’s too simple. No matter where on the pitch you are you will often have specific instructions to play in a particular role. You have to realise the importance of the way that coaches/managers are adapting the way that they play.

Therefore, my philosophy for a while now has been a role-based one. Whilst most roles are still assigned to certain areas of the pitch, when I am looking for potentially useful players I want to assess their suitability to play in particular roles. My philosophy on recruitment in football is wide-ranging and detailed.

That’s why this blog piece is really important to me. A lot of work (you could say hours even) has gone into developing AWRSS, a crappy acronym but it stands for Andy Watson’s Role Specific Scouting. It’s still a work in progress, but without giving it all away I want to explain the philosophy behind it and answer some questions on its application.

The Origins

As many of you will be aware I have written a couple of big summer Season Report and Recruitment Plans based upon Blackburn Rovers. For the document released in May 2021 I devised a Squad Plan based upon what I would think would be a balanced squad for Tony Mowbray and Blackburn Rovers. The image of this is presented below:

Perfect squad for Blackburn Rovers – Summer 2021

This then, of course, got me thinking about those specific roles and how best to recruit for those squad positions. Hence, the birth of the AWRSS.

What are the roles?

In AWRSS I have developed 40 different roles in nine different positions:

Some of those roles may seem to overlap each other, but they do a decent job of categorising players and for each of the 40 roles I have at least one archetypical player from football history in mind some of which I’ll reveal below. They put the flesh and bones on a role, so to speak, and represent how I envisage those roles playing out on the pitch.

The next question is: 

How can you assess how well a player fits into a role and how proficient they are in that role?

Role Definition & Attributes

For each role, I examined what the most important things a player needed to do in order to be successful in that role were.

Below are the examples of two roles and a breakdown of the aspects of the game I think are most important to be successful in that role: Full back (attacking) and attacking midfield playmaker

Identifying aspects of the roles is only half the job, though. How much can we trust in the data? And to what degree is it even possible to assess a player’s proficiency or output from event data alone?

Therefore each attribute carries a weighting of how much data and how much visual scouting, by video or live, should be taken into account when assessing a player’s ability. Weighting visual and data needs to be respected when comparing targets/ players in a full report. 

It is a misnomer that data is more powerful than traditional scouting. A balance needs to be struck. In my opinion, there’s a common-sense order to be followed. 

Data can, in many cases, funnel your thinking or winnow a whole cohort of players to a manageable number of targets to investigate further.  With data, you can sort by basic things that you would want to see from a player. That gives a club a more efficient and targeted scouting regime directing resources more efficiently, which could ultimately help save the club money. That is where the AWRSS data scouting system really comes into its own.

I should also state at this stage that although I have profiled goalkeepers I find that there isn’t a reliable enough set of goalkeeper metrics in Wyscout at the moment to give me enough confidence in a data model to identify good goalkeepers. Therefore only 38 roles are situated within the AWRSS at present. This could change at a later date.

Using data to define an interesting group of players for a role

I am lucky enough to have access to a Wyscout account. For the layperson, Wyscout provides event data (passing, shooting, duels, pressing, etc.) for a vast number of competitions across the world. However, as it is solely event data. Measuring the physical aspects of players and some positional aspects of a player’s activity is practically impossible. Thus I weight visual scouting 100% for these attributes in my model.

Despite this, however, the event data can still be reconstructed in a way that guides us in the right direction. With an attacking full-back we still want a player with an ability to get the ball in the box effectively, carry the ball, make progressive runs forward, have quality on the ball, and defend well in one on one duels. All information that is available to us via Wyscout, for instance.

The difference between my AWRSS model and just looking at Wyscout is how I combine the data with my visual scouting. Some aspects, such as 1v1 defending, are measured pretty straightforwardly by using the defensive duel quantity and win percentage. But something like “quality in final action” requires a lot more input from visual scouting, but also from how other data points, and their relation, is interpreted. I don’t want to give everything away in this brief presentation, but below is an example of how the attributes are calculated for an attacking full-back.

The role score is then complete when the scores from the above attributes are combined together to create an overall score for the role. This is done by a final weighting of the attributes that are most important for the role. Each team/manager/recruitment team will have different opinions on which attributes are the most important for the roles, however, this is something that is easily adjusted for specific requirements.

This is how the Full Back (Attacking) role is constructed to produce a final score.

Once I have this template for what I want from a player I can then run an advanced search on Wyscout to bring me a cohort of players to evaluate. I have created presets for ten cohorts in total:

Here is the full-back example continued. I have sorted the cohort by the Full Back (attacking) role and displayed below are the highest scores within that role from solely the data.

Have the calculations produced a list of players that appear to fit the criteria? From an eye-test perspective from a person that knows the Championship well, I would say that the selection here is quite strong. George Baldock did well in the Premier League, Robinson & Tete play an attacking role for a dominant team this season and the likes of Spence, Brittain & Ebosele have been names mentioned as quality performers this season.

Therefore, if you can accept, by using a control group of a cohort that you know well, that the data is pointing in the correct direction then you can begin to trust the model to identify interesting players in leagues/groups you may know less about.

Here are Band 2’s highest-rated Full Back (Attacking) players from AWRSS:

I would be a liar if I said that I knew the games of each of these players inside out. However, this is the point. If the system generates this list of interesting players for this role then it gives one a good starting point for a European scouting programme, or at least an initial video scouting agenda.

(For more on bands, and how they relate to clubs’ ability to recruit players from outside the British Isles, I’ve done a series of articles  for Analytics FC on Brexitball and the world of recruitment after the introduction of the GBE legislation in January 2021)

Simply put being Band 2 means that the majority of these players will be able to get the required work permit to play in England. Obviously, though, many of the players above won’t be as well known to staff at clubs as, say, the list of players from League Two previously shown. 

That’s where AWRSS can really help: It narrows the number of possible targets, when we’re looking to recruit for one of the 40 specific roles, from hundreds to dozens. Clubs can avoid wasting precious video or live scouting resources on watching the wrong players and focusing on those that are more likely to fit the brief.

The Outputs from AWRSS

Obviously, the options available for what to do with this information are wide-ranging. I have given some examples of potential outputs and uses in Twitter threads for Blackburn Rovers’ recent signings.

There are outputs that can display a whole cohort within a single graph, using particular roles or metrics to look at players on a group level. The variety of displays and dashboards that can be created using the data are wide-ranging and can be very general or very specific depending upon the stage of recruitment that you are at.

In the first instance, it might be useful to plot out whole groups or cohorts to observe the overall picture in a clearer way. An example might be like the below of Bundesliga full-backs, initially used to ascertain where Deyovaisio Zeefuik’s performances for Hertha Berlin sat him in the pantheon of the league in two particular roles. This also had the side effect of being able to observe the correlation, or lack thereof, between the two roles as well.

I can also use AWRSS to look at one individual and their strengths and weaknesses in particular roles.

The possibilities are quite endless really, but here are some further examples of how AWRSS has been used so far:

  • Comparison between two players
  • Text-based role analysis for individual scouting
  • Correlation between roles and players who excel across them

So far we haven’t mentioned little tweaks that can be made to the data, such as using filters. Here, in this example, I have filtered the attacking midfielders of League Two to only include players under 25.

A really key area of recruitment is looking for those players that are coming out of contract soon, either within the year or even the following year. It takes an element of trust in Wyscout’s information, many of the contact expiry dates will be incorrect, but as a basic search it might be worth filtering by contract expiry date.

This example sees the Band 2 midfielders that are under 25 and have a contract expiry date of 2022.

The Flaws & The Future of AWRSS

Some would perhaps say it is unwise of me to discuss possible flaws in the AWRSS model I’ve built and have tried hard to make the case for above. But it is important to be transparent about possible problems with the model and its output. If you’re reading this, and both  smart and kind, then I would love to hear your feedback and ideas on how to tackle these possible problems and make the model stronger.)

  1. Calculations are all automated (now!) But it does take a while to cycle through searches on the Wyscout platform in order to update the data driving the AWRSS model. Lack of automation means it’s not as quick as it could be.
  2. The scores don’t really mean anything. By the time the ranks have been manipulated and weighted accordingly the actual numbers mean nothing other than to rank the players in their roles according to their proficiency.
  3. When players, as is currently the case, are ranked it’s only relative to other players within that cohort. rendering the scores incomparable across different data sets.
  4. The age old problem of defensive data: To rank defensive positioning, decisions, marking etc. is exceptionally tough using event data alone. Defensive roles, and the defensive attributes within those roles, aren’t as reliable as for attacking data and attributes..
  5. Not possible to rank or assess physical attributes.
  6. It can be hard to differentiate some of the roles if, for instance, the key differences between a playmaker and a half-space occupier are things that can’t be measured at the moment (positioning/ball receptions).
  7. The accuracy of the data. That doesn’t relate to the AWRSS model – how the data is used – but to the data itself from Wyscout. A cautionary point to remember that the AWRSS model can only be as effective as the data fed into it. Ie. the quality of  Wyscout’s data.

Admitting flaws and assessing weaknesses is the first step in improvement and should be seen as an inherently positive thing, allowing me to develop solutions and optimizations.

With that in mind, here are some developments and improvements you can expect to see in the AWRSS model in the near(ish) future.

  1. Using positional attribute averages as a comparison to assess player performance. This way a player can be compared across cohorts more reliably and provides a counterpoint to the relational scores
  2. Improving the output. It is important that the data is interpreted correctly but also displayed in a way that makes sense to whoever is viewing it. Some work on charts and graphs is still to be done here.
  3. Visual scouting proformas developed and integrated to fit in alongside the data-driven system to create a holistic view of a player
  4. Easy-adjust final scores that allow for different weightings to be applied by end users i.e. increasing 1v1 defending weighting for full backs
  5. Include metrics such as xT to add more context to some key attributes
  6. Using possession and field tilt to remove some team bias from the player data
  7. Potential use of league and club ratings to be able to compare across leagues more effectively

Final thoughts & Feedback

Hopefully, you have found this run-through and explanation of use. I intend to be using this system for my own independent scouting but if you are interested in learning more or in talking to me about using it within your organisation, or perhaps helping me develop it further and refine it for greater use, then I am happy to have discussions around it.

Any feedback is always welcomed, positive or negative, and you can get in touch with me via @andywatsonsport on Twitter or by email at andywatsonsport@gmail.com.

Wage Budgets in the Championship: Does Spending More Mean More Points?

Blackburn Rovers manager Tony Mowbray often refers to the difficulties the club face in recruitment and on the pitch with the disparity of resources of Blackburn compared to their rivals in the Championship. I decided that this required a piece of investigation with a few questions to answer.

  • What is the picture of the wage budgets in the Championship?
  • Do wage budgets correlate to results on the pitch?
  • Is there a stronger correlation between wage budget and results or wage budget and performance?

In order to get some idea of what wage budgets in the Championship look like I have used the updated FM22 database with the most recent data from the FM club analysts. As a disclaimer, obviously this means that the information is on a “best guess” basis, the actual information of player contracts and wages is obviously private information kept between the player and the club, as it should be. However, there are ways and means of information leaking out into the public domain. Generally, FM data is taken as a close enough proxy to allow basic trends to be analysed.

Analysis of 2021/22 Championship Wage Budgets

These are the figures quoted for the wages across the first team playing squad, the academy players & non-playing staff. It is my contention that these numbers give a good general idea of the amount of money that is available to the clubs and makes an interesting comparison across the division.

To expect Peterborough United to compete alongside Fulham when their overall wage budget is six times less certainly puts things into perspective. How this manifests itself across 90 minutes of competition however is a different matter altogether and something we will investigate later in the piece. But it certainly makes me think about the beating that Fulham gave out to Blackburn a few weeks ago and how that fits in this context.

Briefly, on a Blackburn perspective this number puts us 17th in the Championship. Not quite a bottom 6 budget, but clearly closer to the relegation zone than even the playoffs, never mind automatic promotion.

The total wage figure is likely to be a bit more guesswork than ideal though. I thought that it would be interesting to look at the money on the field. As the quote from Moneyball goes, “Billy likes to keep the money on the field”, so I compiled the eleven most used players for each Championship club. From there I took the estimated basic wage for those players and totaled them up for comparison.

Unsurprisingly, there are a lot of similarities between these numbers and the total wages. However, my attention is drawn to the bottom of the list here. Luton Town’s most used eleven players are paid the lowest amount in the Championship. There’s not a great deal between Barnsley, Peterborough, Blackpool and Luton, but the league performances of the latter two clubs just look all the better with this information.

Coventry are currently sitting in the playoffs but sit bottom six in terms of the wages paid to their most used players. Huddersfield, QPR and, indeed, Blackburn Rovers, are also punching above their weight in the current league table. However, with the tightness of the league (outside of the top couple of places) there is still plenty of time for things to change around in the league positions.

I also thought it would be interesting to see how the total wage budget and most used XI wages compare. The amount of money spent elsewhere in the squad and the rest of the club at the likes of Fulham, Sheffield United, Bournemouth and Stoke City is staggering.

Reading is an interesting case here. They spend quite a lot per week on their first team players, more than Nottingham Forest, and yet their overall wage bill is much lower than Forest’s. 

Does having a greater wage budget equate to better on pitch results?

The laws of economics would suggest that the obvious answer here is yes. If you are paying more then you should be getting a greater return on that investment. However, anyone who has ever bought an Alfa Romeo will be able to tell you that sometimes you spend big and go nowhere.

There is nowhere near a big enough sample size in the 20 games that have been played in the Championship to make any definitive conclusions on this season yet but it is still interesting to observe what the relationship is between wages and points.

There is clearly a positive correlation here between money spent on the first team wages and the number of points won, despite the small sample size. The team who are spending the most, Fulham, have the most points, and one of the smallest spenders, Barnsley, have the fewest number of points.

However, I have calculated the r value of the correlation to be 0.56, which, with 20 games gone, means that there is a significant relationship between the two variables. The r2 coefficient of determination is 0.31, which means that 31% of the points won by these clubs can be explained by the amount of money spent on their eleven most used players.

Interestingly though, there is an even greater correlation between some of our other data.

Is there a stronger correlation between wages and points or wages and performance?

Correlation CoefficientsTotal Club Wages Most Used XI Wages
Points Won0.590.56
xPts0.6250.617

All of the r values are significant but the strongest positive correlation is between the total wage budget and the expected points. 

Expected points are calculated by assessing the xG in a game and using that to produce a point value for each match, in other words, these are the points a club “should” have in accordance with their performances.

Therefore, the amount of money that a club spends on wages has a stronger positive correlation with performance than any of the other correlations calculated. Statistically speaking, 39% of a club’s performance in the Championship in the 2021/22 season (after 20 games) can be attributed to that club’s spending in it’s wage budget.

So, in this case, spending more money does seem to have a positive impact on a club’s performance, and, also, points won in the league. How that money is spent and what it is spent on is probably also significant, but without a detailed breakdown of a club’s spend there is no further data to test this hypothesis further.

Tony Mowbray, therefore, does seem to have a point in bringing up the budgets of Blackburn Rovers’ competitors in the Championship. Although there are occasions where a lower budget team have achieved promotion from the Championship to the Premier League, those occasions, rare as they were before, are becoming ever more rare in recent years. 

However, as the stats for this season so far bear out, the budget only accounts for 31% of the points won. So there is wiggle room for a club to be lucky, or make up for the shortfall of their budget in other ways, i.e. through coaching, recruitment, accounting, and other support staff. However, as I explain in this other blog piece, a lower-budgeted club will need to have all of its ducks in a row and pointing to the goal for them to be successful.

How has Blackburn Rovers managed wage costs in response to COVID/FFP?

Times are hard. The pandemic, in conjunction with FFP rules, has meant that many football clubs are having to make hard decisions as regards the way that football clubs are run. Has there been a fundamental shift in the way that the first team has been run from a financial perspective? It would certainly be a surprise if there wasn’t, but to what extent has this happened at Blackburn Rovers in the Championship?#

There has been quite a lot of criticism of the Blackburn Rovers management and recruitment over recent years. To be honest, I can’t remember the last time there wasn’t criticism over recruitment at Blackburn, probably 1994!

However, with the departure of Adam Armstrong for a large fee and an apparent failure to bring in a central forward to “replace” him there has been more of a microscope put on the club about their recruitment.

A question was asked on Twitter by Gareth Moores about how the wages in the squad stack up as compared to last season. Thankfully I already had all of the data from my recruitment piece in the summer so it wasn’t too difficult to put together the information.

DISCLAIMER: All wage figures quoted are from the Football Manager database, not from any “inside information” or indeed, official information. All salary details are kept private by the club. Also, this only takes into account basic wage (pre-tax) and doesn’t consider any bonuses or clauses.

2020/21 Season

Blackburn Rovers decided to try and tackle this season which was condensed by the COVID pandemic by having quite a large squad. All five permitted loan spaces were filled, albeit two came in January, and there were many players in the final year of their contract who clearly weren’t trusted to play a lot of minutes.

The strategy proved wise in one way, Rovers did suffer a lot of injuries through the campaign. However, it didn’t work well overall because the club ended up finishing 15th in the league table. Whether that was a “deserved” placing or not is irrelevant but for a much more in-depth look at Blackburn’s season please see my Blackburn Rovers 2020/21 Season Review & Recruitment document which breaks it down in full.

The squad, their wages, and minutes played are displayed in the table below.

You can see the size of the squad here, especially in defence and midfield. Also, looking at the minutes played by some of them you have to question the amount of money being paid to some of the players. Some of them were very unfortunate with injury (Rankin-Costello, Evans, Wharton & Ayala especially) but bringing back Stewart Downing, albeit on a much reduced rate than the season before, is certainly a questionable use of resources.

Our highest paid players were Sam Gallagher, Daniel Ayala and Lewis Holtby. None of whom made much of an impression in our performances and results in the season. To be fair, Adam Armstrong, Thomas Kaminski and Darragh Lenihan who were our other main wage earners were definitely the key players in the season.

Charlie Mulgrew was out on loan at Fleetwood for the season, so in fairness his wages weren’t totally being paid by Rovers. Fleetwood’s contribution though wouldn’t have been more than around £4000, so we have paid desperately for that new contract Mulgrew signed after promotion. Two years we sent him on loan to League One on those wages that couldn’t be covered. A poor piece of squad building there.

22% of the total wage bill per week in the second half of the season was being paid on loan players. Of the loanees brought in, Taylor Harwood-Bellis played the highest percentage of minutes and did well for the club. Harvey Elliott clearly provided a big source of quality, goals and assists. Douglas, Branthwaite and Trybull were all less successful, for various reasons. I feel that 22% of the total wage bill is too high though personally, and I’m sure that many reading this will not be happy about it. However, if you are going to bring in quality from the division above, they are on big contracts and often the loaning club will have to cover that contract, or as much as they can afford, at least.

The final point of analysis I want to make on 20/21 is that, in an ideal world, you would like your wages paid and minutes played to have a positive correlation. That is to say that: you pay your most influential players the most money, and those are the players that play the most often. This way you can say that you are being efficient with your spending.

Blackburn Rovers’ minutes played to basic wage r value (the co-efficient of correlation) was 0.42. A very weak correlation. This is displayed in the graph below.

Many of the reasons for this are explained in the analysis above. But the departure of many senior players on big contracts should hopefully see some of this discrepancy addressed moving forwards.

For example, if this was compared to Wycombe Wanderers’ for the same season:

You can see the difference from one squad to the next. The trendline being so steep there means that the correlation is much greater and therefore the wage spend appears to be much more efficient in this scenario.

Summer of 2021

Eventually, on 30th June 2021, many of these contracts were allowed to expire and the loan signings were sent back to their clubs. The figures highlighted in red in the previous graphic demonstrated how much the wage bill was reduced. This totalled £111,000 per week.

Now, as most Rovers fans are well aware, the club is flirting with FFP viability. In the previous financial year (2019/20) the club’s accounts showed that the wage to turnover ratio was a frankly ridiculous 189%. The following images belong to Kieran Maguire (@KieranMaguire) who did a fantastic video with Glenn Entwistle of Rovers Chat explaining the extent of Rovers’ predicament.

In that video, Maguire explains that Blackburn have made losses totalling £57 million over the last three years, the limit for FFP is £39 million of losses. Thanks to the Category 1 status of the academy the approximate £5m fees for supporting that wipes off £15m of that number, then creative accounting around COVID and other costs that the club incurs means that Blackburn will probably squeak under the limit, but it is clear how tight those numbers are to avoid penalties.

These two images go some way to highlighting the real problem that the club has in terms of being run sustainably.

Wage spend vs turnover in latest financial figures

Only Reading have a worse ratio of spending more money vs turnover than Rovers. Although, as is obvious in this graph, there are many other culprits in this particular measure (including the much heralded Brentford). The finances of the Championship are clearly ridiculous, but it is also clear that the club does need to do something about this.

Maximising income is an objective that appear to be beyond the club’s capability. There is widespread condemnation of the way that the club communicates with its fans, the way that many fans feel that they are being treated, both financially and emotionally, and the lack of ingenuity in the commercialism of the club. So if maximising income isn’t a strategy that is working, or that the club isn’t good at, then cutting costs has to be the way forward if you want to get closer to sustainability. Which brings us to the current situation.

First Team Championship Squad 21/22

As well as the mass exodus of players who’s contract had expired Blackburn Rovers also sold Adam Armstrong for a fee reported to be around £15m to Southampton. This leaves the playing squad at the end of the window looking as follows.

The first thing to note is that the squad size has been reduced. There are certainly fewer names in midfield but hardly any experience has been brought into the squad to replace that which departed.

In turn this has brought the wage bill way down from how it ended last season.

This table gives the figures in a more concise way and here we can see that the total has been reduced from £247k per week to around £152k, a reduction of £94.7k per week. This is a drop of 38% from last season.

Extrapolating that difference out over 52 weeks, that comes to around a £5million saving in first team wages. Now, obviously, it isn’t at all as simple as that. There are bonuses, tax, wage rises that we won’t know about. But even if the figures used aren’t exactly right it is clear to see that a substantial reduction has occurred.

The club is currently paying an average first team wage of £6,100. Maguire stated on the podcast mentioned above that the Championship average salary is more around £15,000. This figure surely puts Blackburn very low in the average wage table of the Championship. The ceiling of our wage structure is currently £15k, so the maximum we are currently prepared to pay is the average for a Championship club. It puts into perspective the difficulties the club can have to buy established talent.

That ceiling can be broken perhaps for exceptional players, I believe the club was potentially willing to break it for Adam Armstrong, but this could cause more problems than it solves.

The reduction has happened across all departments of the squad. The end of Mulgrew and Bell’s time as well as the end of Douglas’ loan deal has meant that the promotion of Carter, Magloire and the recruitment of van Hecke (loan), Pickering, and Edun has been done without an increase in the wage bill.

The cuts have been even more substantial in midfield and attack, especially midfield. Evans, Bennett, Downing, Trybull etc. were all big earners at the club, but as we saw in the previous table, not regular first team members. So the wages have been reduced but arguably not at the cost of a reduction in quality of the starting XI, unless injuries strike again. The difference in attack is made up simply of Adam Armstrong’s £14k contract coming off the wage bill. (Just for information and how far Blackburn are behind, Southampton are reportedly paying the former Rovers star £50k per week in the Premier League.)

Interestingly, the amount of salary being paid out to loan signings has been massively reduced. 65% lower this season than at the end of last. Principally because no experience has been brought in. Harvey Elliott had very little experience of course, but he had insane quality, which he has gone on to prove in the Premier League. How much faith you can put in this I’m not sure, but Felix Pate’s (@LGOPFelix) model has Joe Rankin-Costello as the player at the club with the highest peak rating, not any of our loan “stars”, so with less expense may ultimately come less quality.

Concerningly, Blackburn had the lowest player of peak rating of any Championship club. Though I’m sure that will change as and when some of the really young players start gaining experience and showing their quality.

Comparison of Squad Maps

Speaking of really young players, what the current regime have managed to do is preside over a complete overhaul of the age profile of the squad.

The players in red from the 20/21 squad map above are the leavers.

Loan players in deep yellow and Edun in bright yellow as a permanent signing. But the image is clear in that only two players now feature in the “experienced” section and five players in the “peak” zone. The vast majority of the squad are young, “pre-peak” if you prefer. The immortal line spoken by Alan Hansen springs to mind here, “You can’t win anything with kids.”

Conclusions

The management at Blackburn Rovers may well not want to “win anything” right now. It is an exceptionally difficult league to get out of. A club the size of Blackburn need a lot of things to align in order to make it happen in the current situation. A lot of correct decisions need to be made across the club, superb on-pitch management, and a slice of luck as well.

I am reticent to criticise the club too much about the information in this document. I’m sure many will think that if we have that money in the budget then it should be ring-fenced for playing staff improvement. Without being on the inside and having all of the information there is no way one can suggest what the money should be used for. This is where one has to trust the management of the club, the problem is a lot of people don’t.

It will be interesting to see how the season progresses with this much reduced wage bill. If the team can maintain its performance in the league then it could be seen as a fantastic coaching and squad planning performance.

The Poison Chalice That Is The Championship’s 7th Place

When having a debate about finishing position in the Championship I took it upon myself to investigate what happens when a team finishes 7th. I couldn’t remember the last time that a team finished 7th and did well the season afterwards. I cycled through the finishing tables just waiting to find one and I kept having to go back and back and back until eventually, in 2010, I found Brendan Rogers’ Swansea City side who managed to finish 3rd after a 7th placed finish the previous year.

I also noticed that some of the clubs that finished 7th seemed to really struggle. But it was only when I actually traced the clubs that finished 7th that I realised the horrific truth. Every team that has finished 7th in the Championship since Swansea has gone on to finish between 13th and 19th the following season. The uniformity of that drop-off astounded me, and a fair number of other people on Twitter as well!

Of course, finding the fact was only the beginning. I couldn’t let this lie without conducting some kind of investigation as to why this was happening. There were a few hypotheses that came to mind; mental fatigue, disappointment, transfers out, managerial changes but I wanted to dig into the stats first of all to monitor the performance differences.

I also wanted to find out the opinions of people who experienced those seasons much more acutely than myself. The fans of the 7th placed clubs that watched their hopes turn into mid-table mediocrity at best. Some common themes came out of their opinions as well that are very interesting.

Poor Form At The End of the 7th Place Season

It is sometimes thought that the team who finishes in 7th place is the one that stutters towards the finishing line. In some cases this is true, Forest didn’t stutter as much as implode in the 19/20 season, but more generally poor form at the end of a season is often seen as an indicator of a troubled season to come.

However, there really is quite the range of results looking at the last eight seasons. The mean is 9.375 across the 6 matches at the back end of the 7th place season. This translates to around 1.5 points per match which is around the rate you would expect for a 7th placed team.

It is the range that is startling though. Forest’s disaster and Middlesbrough’s charge in the last two seasons combine to make a range of 12 and those two results alone are probably enough to dismiss this idea. Looking back Leeds United and Reading fell away somewhat and perhaps that was an influence in their subsequent slide. I would say the Forest slump certainly had an effect on their subsequent season.

Nevertheless, the remaining five clubs showed a good level of performance at the end of the season, but still suffered from this phenomenon.

A Bad Start – Potential Hangover

So if it isn’t a poor end to the 7th placed campaign, perhaps a very poor start to the next one is a big contributing factor.

Again, there is quite a big range to the points that the clubs in the sample managed to get but that is really as a result of Leeds United’s excellent start to the 2017/18 season. All, or the vast majority, of these teams would’ve had aspirations of playoffs before the season started of course and to achieve that a team would need around 1.6 points per game. Only Leeds and Reading from this set of teams managed this, Preston, Middlesbrough, Forest and Bolton averaged less than a point a game.

Obviously we know that these clubs all finished bottom half but there are signs that clubs that finish 7th are more likely than not to have a poor start to the following season. The last 3 teams certainly follow this pattern, though Bolton Wanderers’ 2013/14 start is definitely the poster boy for this theory.

Summer Transfer Business – Lack of Investment or Loss of Important Players

As a team that finished very close to the play-off positions it stands to reason that the club will have players that are desired by better teams. Players might’ve have been hoping for promotion with their clubs and, having failed in that objective, may feel forced to leave to achieve their goals.

Is it also the case that owners/managers may think that their team was so close to achieving their goals in the previous season that they don’t need that many new additions to get into the top 6.

The image gallery above highlights the key transfer activity in the summer following a 7th place finish for all the teams I have comprehensive statistical data for.

All of the expected trends highlighted earlier can be seen in this sample though. All clubs, with the possible exception of Preston, lost at least one key player, albeit for decent fees in general. Matty Cash for Forest, Flint & Braithwaite for Middlesbrough (although neither player performed to their full potential at the Riverside), Wood & Taylor for Leeds, and Ipswich’s Daryl Murphy.

Of course, it then becomes a question of how you replace those players. Leeds United went for what appears to be a scatter gun approach, bringing in 23 players in the summer alone. Some of the intake have proven to be excellent signings once managed well Alioski & Klich winning promotion under Marcelo Bielsa and Pontus Jansson made the club a nice profit. However, there was no real replacement for Chris Wood’s goals.

Preston North End didn’t really lose much, just Greg Cunningham for a decent fee to Cardiff. However, they strengthened on the cheap. Spending very little and gambling on young EFL players and young loanees from Manchester City. It didn’t work for the club and they have yet to see any return in terms of profit or performances from those young players.

Ipswich were really struggling financially at this time and weren’t able to invest in playing staff. Interestingly one of their deals was a player swap seeing Adam Webster come in with Matt Clarke going the other way. Both now very highly rated defenders.

Middlesbrough had been 5th and 7th under Tony Pulis but the loss of parachute payments and a change of style under Jonathan Woodgate meant a change in transfer policy. Young, cheaper players were sought and didn’t get near replacing the experienced quality that was released and sold.

Nottingham Forest are a stranger one. They lost dynamic left-back Cash but brought in quite a number of players and many of them experienced at the level. However, the mix clearly didn’t work.

Managerial Changes

I think it can be quite hard to classify whether 7th place is a successful season or a failure. In part it will depend on the club’s pre-season expectations, partly down to the wage spend or net transfer fee spend but ostenisbly it is a failure. You put in all of the effort and achieve a good points total, but you have to come back and do it all again the following season.

So in a way it is difficult to know whether managers would be sought after or not. In our list the only managerial changes that happened in the break between seasons were at Middlesbrough as Tony Pulis’ contract was not renewed and Jonathan Woodgate came in and at Leeds in 2017 when Garry Monk was replaced by Thomas Christiansen.

Both of those were rookie managers and it is fair to say in hindsight that the decision to hire them were contributing factors to the problem.

Most other managerial changes in the sample happened after the expectations for the season were not being met. As was seen in the data above about poor starts to the season it is those poor starts that led managerial changes in the following season. This applies to Sabri Lamouchi last season and Jonathan Woodgate the season before.

Overperformance in 7th Place Season

With the use of Infogol’s xG/xPts service going back to 2014/15 I was able to map teams’ actual league finishes to the expected positions according to their xG data.

Perhaps unsurprisingly, in four of the six seasons a team’s expected position was lower than 7th. Preston can clearly find themselves unlucky to have performed so well and missed out, and perhaps that information informed their transfer activity as listed above, also the disappointment may also contribute towards their slow start the following year.

However, all of the other clubs “deserved” to finish outside of the playoff places. Some by quite a distance, and some “should” have finished in the bottom half of the league. This is probably the strongest evidence we have seen so far as to how this phenomenon can be explained. The gap between finishing 7th due to results and how the team has actually performed using underlying performance metrics means that a reversion to the mean is likely to take place over the next set of fixtures, unless there are fundamental improvements to the way that the team play.

Underperformance in Following Season

Following on from the previous hypothesis it certainly made sense to look at potential underperformance in the season afterwards. If there is evidence that the teams should’ve finished higher than they did then that also adds a piece of evidence to the explanation.

Almost all of the teams finished in the bottom half of the table by position and also by performance, with the exception of Wolves in 2015/16 who could’ve scraped into the top half.

This information suggests that there was no real underperformance the season after a 7th placed finish and combining this with the previous graph it is possible to suggest that the 7th placed finish for most of these teams was something of an aberration.

In fact, a number of the clubs still overperformed in this subsequent season. Ipswich seem fortunate to have avoided relegation, a fate that came their way two seasons later. Preston escaped the relegation battle in 18/19 but perhaps they should’ve been more embroiled in it.

Interestingly, Forest had a higher expected position in their subsequent season than their 7th place season (14th over 15th) but most clubs performed worse. This does suggest that there are more factors at play, some of which will be those reasons investigated above (recruitment, managerial changes, psychology) but there may be more to see by looking in detail at some performance metrics.

Performance Metrics Season-by-Season

This next section just takes a snapshot of some interesting performance metrics from the two seasons. There is also a graphic comparison between the two.

Of course, these metrics don’t explain everything and so I have also asked an expert fan opinion from the club involved for their take on the season to see if the evidence I have gathered adds up to how it seemed for the fans.

Nottingham Forest 19/20

These statistics from Wyscout paint an ever clearer picture of Forest’s fortune in getting close to the play-offs in their 7th place season.

They lagged way behind their opposition over the course of the season in penalty area entries, passes into the final third and progressive passes. An explanation for this is perhaps seen in the PPDA numbers that suggest Forest used a low block and other teams pressed them a bit harder.

Interestingly there are clear signs of improvement in the second season over the 7th placed season here for Forest. This is borne out in the expected position data we saw but goes against what you would expect from the positions. The team shut the opposition out of their penalty area much more, albeit Forest also got (even) worse at penetrating the defences of their opponents.

Forest’s pressing became slightly more active in their opponents’ half while the opposition became less active against Forest.

Fan view

The way it happened for us was probably slightly different to the others as far as the dramatic fashion we dropped out the top 6. In the top 6 from matchday 8 until the final day of the season when a goal difference swing of 4 was just incredible really. The players just didn’t recover mentally for the start of the new season and we started that 20/21 season with 4 defeats and the sacking of Sabri.

It was a very quick turnaround if I remember to the next season which didn’t help us. We lost Matty Cash and didn’t invest that money well at all.

Also, I think you could argue we overperformed slightly in that 19/20 season. Wyscout had us 11th on xPoints.

Chris Kearney (@AnalyticsForest)

Middlesbrough 18/19

Tony Pulis’ Middlesbrough side played the way that we know the Welshman to operate. Defensively with a direct style. This is borne out in the data that perhaps doesn’t show how “effective” that style can be.

Boro lagged behind their opponents in all metrics taken from the Wyscout database for that season. There is a change of style evident within the data for the second season under Woodgate & then Warnock but is also shown to be ineffective for the most part.

As seen here Boro’s defence became less able to keep their opponents out of their penalty area and although they managed more passes in the final third, they were less able to play the ball forward as regularly. The higher pressing style was matched by their opponents as well, clearly finding Middlesbrough possible to get at higher up the pitch as they held the ball there for longer than under Pulis.

Fan view

If you look back to 18/19, we started well and were comfortably in the top six for 2/3rds of the season. We finished really poorly, including a run of six straight defeats, and ultimately Pulis left along with a couple of high earners like Downing, Besic etc. We appointed Woodgate that summer, tried to change style and it didn’t work. He was out of his depth and never settled on a style or team. There was limited money for new players. While Dijksteel and Bola have come good since, they were both pretty disastrous in their first season. If it hadn’t been for Warnock’s appointment, I think we were in serious danger of going down.

Matthew Rea (@m_rea)

Preston North End 17/18

From the numbers it is clear to see how effective Preston were in their close shave with the playoffs. They were much better than their opponents at getting into dangerous positions, they pressed high and progressed the ball well.

There is then a really stark difference in the following season. Interestingly they improved their passes in the final third stats and reduced their opponents’ same metric, and yet allowed their opponents far more access their own penalty area.

The first two metrics are the ones that really explain what went wrong for Preston. There were no real losses in personnel or management than can explain this big change. Perhaps other teams had simply worked them out? Preston certainly didn’t press as high in this season either, almost 30% less than the previous year.

Fan view

In 2018/19, after finishing 7th the previous season, North End failed to strengthen and sort of stood still, resulting in going backwards.

Having sold Jordan Hugill when bang in Play Off contention in January 2018, and then selling Greg Cunningham in the summer, earning around £14 million in transfer fees, North End did things the cheap way. Lukas Nmecha was brought in as a raw 19 year old on loan from City and Andrew Hughes was a left back signing for around £200,000 from Posh.

1 win from the opening 10 games had Alex Neil under heavy pressure, losing Hugill, Cunningham, and injury issues to Callum Robinson and Sean Maguire disrupted things massively. After a 3-3 draw at Villa Park in November, 1 loss in 11 followed and PNE then strengthened in January, albeit 6 months too late.

Brad Potts and Jayden Stockley made good impacts, and North End sat 7th after 38 games. As usual though, the squad lacked depth and injuries, suspension and fatigue left us losing 6 of the last 8 games to stumble to 14th. Had Callum Robinson, on course for 20 goals, stayed fit, it could’ve been a different story but PNE failed to adequately reinvest the £14 million they earned.

Oli O’Connell (@gorn__)

Leeds United 16/17

Similarly to Preston, Leeds show a slight dominance in their 7th place season that is then totally reversed in the following season. It is exactly the type of pattern you would expect to see in this investigation.

All defensive metrics suffered in the subsequent season. Garry Monk’s departure and the style implemented by Christiansen and then Heckingbottom clearly led to Leeds being more porous and allowing their opponents more access to their box. This despite a higher press across the season.

Fan view

17/18 there were a few factors. Management was a big one. As much as I don’t like the guy, Garry Monk did a good job the previous season so him walking away didn’t help. Thomas Christiansen started well but we quickly saw that was the exception not the rule. Some of his in-game decisions were poor. He also shipped out Mateusz Klich after a couple of games, and we see now how that decision looks.

He was replaced by Paul Heckingbottom who is the only Leeds manager that – to this day – I have no idea what he was even trying to do. Came to Leeds off the back of 1 win in 17 at Barnsley, and was absolutely hopeless.

It wasn’t a window like 11/12 where the writing was on the wall. Klich, Pontus Jansson made permanent, Samu Saiz, Ezgjan Alioski, and (before he played) Vernon Anita all looked like good signings. Plus Adam Forshaw and Tyler Roberts in January. Although GK was a big problem as Felix Wiedwald was poor, as was Andy Lonergan, leading to Bailey Peacock-Farrell getting the shirt. The only outs that were an issue were Rob Green and Chris Wood.

We really missed Chris Wood, 30 goals the previous season and no-one took on that mantle at all. The best chance was Pierre-Michel Lasogga on loan and he wasn’t fit/motivated enough despite having lots of ability. Where 11/12 was awful management from the boardroom, this was more down to the people in the dugout – Bielsa then fixed that.

Mighty Whites Pod (@mightywhitespod)

We were hugely reliant on Hernandez and Chris Wood. Wood scored 30 goals. Monk left in the summer and Wood left after 2 games. Replaced by an unknown manager who had us too after 8 games but lost the plot discipline wise and he got sacked. Then Heckingbottom was rubbish.

Josh Hobbs (@JoshAHobbs)

Ipswich Town 15/16

Back to the “effective” brand of football here with Mick McCarthy’s Ipswich side. Again, even in their 7th placed season their opponents entered Ipswich’s penalty area more often but clearly weren’t as effective as the Tractor Boys as they gained more points.

Looking at the passes to the final third and progressive pass numbers, they are exceptionally high in 15/16 and its’ no surprise that they dropped off substantially the following season. A part of that may be down to the loss of Daryl Murphy and the inability to replace him as a top target man.

It is clear to see here that Ipswich’s attacking output dropped off a cliff in the second season. Murphy’s loss clearly hurting the club.

Fan view

Whilst we finished 7th, we were always some way outside play off contention, a poor April had seen us slip from a very small outside chance to no chance. We won our final 2 games which were total dead rubbers to finish 7th, but were still 5 points outside the play offs and nowhere near.

We had finished 6th in 2014/15 with 78 points and everything had clicked with Murphy scoring 27 goals, he didn’t have a brilliant season the year after, but late on in the window in August 2016 he was sold to Newcastle for £3m, and just wasn’t replaced. Leon Best picked up on a free transfer and was a total failure – so we just lost our focal point and main goalscorer from a team that had already drifted a long way backwards, and were already a mid table side.

Joe Fairs (@joefairs)

Will Reading 21/22 follow in the footsteps?

Using the fantastic guide given by Peter Loehmann (@phloehmann) where he has gathered all of the 1-24 predictions from EFL experts Reading come out in 15th position. This would be bang in the middle of the usual range for previous 7th placed finishers.

They are suffering from financial difficulties. According to Kieran Maguire’s most recent study into the accounts of Championship clubs, Reading were spending 190% of their turnover on wages. This is sailing very close to the wind for both FFP regulations as well as being extremely poor business.

However, I’m not the expert on Reading’s current situation having not watched a 90 minutes of any of their games this season. The Royals currently sit 18th having won one and lost three of their opening games, so it certainly fits the trend of the poor starts we saw above.

To get the educated view on Reading I asked The Biscuit Analytic (@biscuitanalytic):

“On the subject of history repeating itself, it’s more than likely. Reading tried to make a run at promotion the last few seasons and it hadn’t paid off. Having had to now sell players and trying to replace them on frees or with academy players means we are down on quality. It feels not quite a mirror image but certainly one where Reading are looking at financial errors as part of the issue to blame for a lower league position the year after missing the playoffs”

The Biscuit Analytic (@BiscuitAnalytic)

The remainder

With Wyscout data only kicking in from the 2015/16 season it wasn’t possible to delve into the stats as deeply for any of the other clubs in the decade.

As a result I went searching for some expertise to help me to understand where the clubs went wrong and whether any of the theories discussed above show up in their seasons.

Wolves 14/15

Wolves’ 2014/15 season was a huge case of what might have been, most of which hinged on the fact it was Bakary Sako’s final year of his current contract. The Malian was an integral part of the team, part of a devastating trio of forwards with Benik Afobe and Nouha Dicko who carried the team on a wave of exhilarating attacking football to within goal difference of finishing in the play-offs.

Had we done so, the momentum created in that second half of the season would have served us well I feel, perhaps culminating in promotion, an extension to Sako’s time at the club and an opportunity to tackle the Premier League. As it was Sako moved on a free transfer to Crystal Palace, Nouha Dicko did his ACL in the fifth game of the 15/16 season, leaving Benik Afobe to near enough fend for himself as re-investment to replace Sako was unavailable.

Afobe, who performed relatively well given a distinct lack of support from other areas of the pitch, angled for a move to Premier League Bournemouth in the January transfer window. Kenny Jackett’s response was to recall forgotten man Bjorn Sigurdarson and spend £3m on long-term target Joe Mason. Neither were able to pick up the goalscoring baton and without those goals, Jackett reverted to a more circumspect approach, seemingly unable to cajole the team into climbing the table and settling for a rather underwhelming final league position, away from danger, but no threat to the play-off places

Musings from Molineux (@molineuxmusings)

Here we are seeing the themes of recruitment not being good enough and perhaps trying to rely on a previously successful style being found out by opposition. As we have seen it is rarely effective to expect the successful aspects of what got teams to the brink of the playoffs being enough to force your way in the following year.

Reading 13/14

Reading after being relegated in 12/13 started the season under Nigel Adkins back in the Championship in 13/14. 100 points, 100 goals was the target. The club never quite achieved the goals they set for themselves during 13/14.

Despite starting 13/14 scoring goals and winning games, the last 14 games only saw 18 points and they missed the playoffs on the final day. By this point, it was clear Anton Zingarevich had sold Reading up the river, with Adam Le Fondre sold to pay a HMRC bill, Sean Morrison following him to Cardiff in mid summer. Reading also lost first choice keeper Alex McCarthy.

Following a relatively strong start to the season, Reading were in the top 10 by the end of September but by this point it was clear Reading were struggling with squad depth particularly in central midfield, where Oli Norwood played alongside 4 different midfield partners in 4 games, in which Reading conceded 9 goals. After this, the wheels had come off under Adkins, with his style of play not dominating teams in the Championship with players unsuited to the style Hope Akpan, Jake Taylor, John Mackie coming in to replace injured players such as Danny Williams and Jem Karacan.

This led to Reading losing 7/11 games after the reasonable start, culminating in a 6-1 loss away at Birmingham. Adkins was fired in mid December. Steve Clarke was bought in as a replacement and never found his feet with the squad, winning just 6 league games. This may be slightly attributed to the fine FA Cup run the club went on making the semi finals that season losing in ET to Arsenal. Reading resting players in league matches during the season prioritising the FA cup matches once they got past the 4th round.

The season ended with Reading winning just 1 of their final 10 league games, struggling to score scoring just 9 goals, after Glenn Murray having returned to Brighton in January. The sole win was a 3-0 win against Derby on the final day stopping The Rams from making the playoffs.

The Biscuit Analytic (@BiscuitAnalytic)

Bolton 12/13

The decline in Bolton’s performance in the 2013/14 campaign, in relation to the previous season, can be put down to a number of factors.

A negative feeling had festered around the club, after missing out on the play-offs at the end of the 2012/13 season with a thoroughly deflating 2-2 home draw with Blackpool.

The loss of rock-solid loanee Craig Dawson meant the defence was porous at its heart, while their big £1m summer signing Jermaine Beckford took too long to acclimatise to the team.

It took Freedman’s side eleven games to get a first three points of the campaign at Birmingham, and although they followed that up with an undefeated run of five games, including three wins, the defence was still being overran. A 3-2 defeat at local rivals Wigan and a madcap 5-3 reverse at Leicester preceded a dark day in Berkshire. An Adam Le Fondre inspired Reading would devour a rotten Wanderers side 7-1, with the increasingly beleaguered Freedman suggesting afterwards the players as a whole were not up to the task, in terms of quality.

Three losses in the next four, as we moved into February meant any likelihood of a late surge up the table was over. This rendered immaterial the following three-game winning streak, including a surprising 4-0 home thumping of Blackburn Rovers and a 5-1 win at Elland Road.

Ending the season with one defeat in ten certainly gave fans cause for optimism though, with the Scottish manager showing a propensity for a shrewd loan signing once again, in the form of target man Lukas Jutkiewicz. Alas as financial issues started to rear their head, Jutkiewicz would not return and moved down the M65 to Burnley instead Overall the horrendous start, a hangover perhaps from the final day debacle, hampered any real hopes of competing for the play-off places again.

The lack of a potent striker, despite plenty of options in Beckford, David N’Gog, Joe Mason and Jutkiewicz meant Wanderers drew games they should’ve won. The quartet only scored 23 goals between them but it was in the heart of defence, where the often calamitous Zat Knight and underwhelming Matt Mills had mainly held sway, that Wanderers struggled the most.

Lee Tennant (@trottertenzo)

Middlesbrough 11/12

Weirdly, 11/12 and 12/13 were quite similar seasons, and typical or where we fell short under Mowbray. Both times we started well, and were close to automatic spots around Xmas and then collapsed after Xmas.

In 11/12, we picked up a little to have a small chance of sneaking into the top 6 until the last day. But the following year, when the slump started it didn’t stop and we were probably relegation form January onwards.

In Mowbray’s defence, I think in both years we were nowhere near promotion standard. He raised expectations above what was realistic and then suffered the consequences.

While 12/13 wasn’t a great season on paper, in the longer term it was the start of a positive change at the club. Strachan’s overpaid army of mediocre SPL rejects were moved along in the summer of 2012. We brought in Leadbitter on a free, Friend for £100k, Ben Gibson started to break into the team. It was the basis of the team Karanka would take to the play-off final in 2015 and then promotion in 2016.

Matthew Rea (@m_rea)

Leeds United 10/11

11/12 can be put down to two words. Ken Bates.

Leeds got promoted from L1 with a good side, couple of good signings lead to 7th in the 1st season. That summer, the club lost Kasper Schmeichel, Bradley Johnson, Neil Kilkenny, and Max Gradel. While signing a lot of aging players that did not work out.

We were in with a shout of the playoffs at the halfway mark, but Bates refused all transfers that Simon Grayson put forward such as Gareth McAuley who was available cheap when we desperately needed a CB. Bates also basically forced captain Jonny Howson out of the club to get £2m. He then got to February 1st when the window closed and immediately sacked Grayson. Leeds were 7th at this point if I recall correctly.

Bringing in Neil Warnock did not work in the slightest, he’s done well at most clubs but he was abysmal at Leeds so we fell away badly.

Mighty Whites Podcast (@mightywhitespod)

In 10/11 we had Simon Grayson in charge – good first season back in the Champ after promotion but a leaky defence cost us playoffs. The next season the squad was worse and Grayson couldn’t fix the defensive issues. Sacked and replaced by Warnock == death.

Josh Hobbs (@JoshAHobbs)

Interestingly, in these final four accounts from the fans we see some aspects that we haven’t investigated above. A lot of ownership issues for Reading, Bolton and Leeds that meant that recruitment and money were becoming the dominant narrative for each of the clubs. Sometimes this came around from horrendous mismanagement of funds. If any of the clubs had sneaked into the playoffs and been successful getting into the Premier League then their futures could have been so different.

Bolton are obviously the club who suffered most from this, going all the way down to the fourth tier, although as I write they are having a very strong start to their League One season. Reading though are still suffering from the Zingarevich era and their chances of earning that promotion are being severely handicapped by the financial hangover from this time.

The loss of parachute payments really affected Middlesbrough owner Steve Gibson’s approach to squad building. Tony Mowbray was working on more of a shoestring budget and this is something that hindered recruitment. As Matthew said though, it was actually the beginning of a good era for the club resulting in promotion a few years later.

Final Conclusions

When I originally found this stat it was as part of an argument about whether it matters where clubs finish in the Championship between 7th and 15th. It really is a remarkable stat but when you start to dig into it there really is a lot of reasons that build into why this happens more often than you might think.

In reality, the difference between the quality of the teams that finish in midtable in the Championship is close to negligible. As we demonstrated here, most of the 7th placed finishers in the “data era” according to their xG data “should have” finished much lower than 7th (except Preston).

In most cases across the whole cohort recruitment has been questionable at best. A mix of losing the players that took them close to the playoffs, financial problems perhaps caused by chasing the PL dream and perhaps owners/management believing that the playing squad was close enough to not add as much as they should have, meant that teams slid backwards rather than pushing forwards.

In the performance metrics every team, other than Nottingham Forest, really struggled to maintain the tightness of their defences. Most clubs also saw a reduction in their attacking outputs. Some of this is related to the recruitment issues discussed, but some of it may be down to the psychology of getting so close and not being quite ready to chase the dream again to the same extent. Certainly we saw that a lot of the clubs, especially recently, had unusually poor starts to the following season.

It looks like the trend is continuing at the moment with Reading’s struggles. If anyone has any other theories, comments or opinions about this blog or this topic then please message me on Twitter or comment on here. Hope you found this as interesting as I did!

Ever Decreasing Markets: What have the GBE rules and COVID done to the Championship’s shoppers?

Blackburn Rovers allowed their Head of European Scouting, Glyn Chamberlain to seek pastures new last week. This blog piece seeks to explain some of the possible reasons for this and why it is that most Championship clubs will see the European scouting roles to be a luxury that not many can afford.

This is also a kind of Championship-specific version of the excellent Rory Smith piece in the New York Times, in which he discusses the stagnancy at the very top of the transfer market. His newsletter is well worth subscribing to as well.

I said in my last blog that clubs should be using any and all means necessary to recruit the appropriate players for the roles that they need to fill in their squads. Until relatively recently the avenues available to clubs in the UK, even lower league clubs in the EFL, were fairly broad. Most transfers were, of course, within the domestic market (we will talk about this more later) but the more ambitious or adventurous clubs could go out into Europe and recruit players from practically anywhere in the EU under the freedom of movement. This led to a fair few transfers coming into the country from areas such as Portugal, Germany, Austria, France and Belgium, amongst others.

Just to give a quick illustration of where Championship clubs would spend their money in foreign markets I did a couple of basic donut charts last year when researching this topic.

We will go into more depth in this piece in terms of the actual spend and share of the market taking into account domestic transfers as well, but what these images do illustrate is the amount of business pre-Brexit that was being done in EU territories.

The Mendes-inspired Wolves recruitment had a massive effect through 2016-2019 as Portugal was the chief territory for Championship imports. However, the wide variety of countries that Championship clubs used as shopping areas really was quite vast. Let’s now have a deeper look at the GBE rules that have changed this.

Governing Body Endorsements

When Brexit was confirmed it was always going to have an effect on football and recruitment, it was just a question of waiting to see how the FA were going to handle it. They have ended up producing a points-based system in which a player coming into the country to play football has to accrue 15 points across the criteria in order to receive a GBE (work permit) to be allowed permission to register with a club in England.

Regular followers of my work will be familiar with my images from the work around GBEs. However, it is worth re-iterating the situation as it stands. Any player who plays international football for a top 50 FIFA ranked country will get a GBE (depending on how many minutes they have played) and also players from Band 1 and Band 2 leagues are also highly likely to qualify.

Any league below Band 2 it becomes trickier. However, Band 3 leagues are interesting because importing players from these territories (Brazil, Argentina, Russia, Mexico) was all but impossible before Brexit. This is an interesting new avenue for PL and EFL clubs and we have seen Middlesbrough experiment with this with the exciting signing of Martin Payero. However, as we will see later, this is a risk that very few English clubs have attempted so far.

Most of the “value” shopping areas that clubs were beginning to explore pre-Brexit (Central Europe, Scandinavia, 2nd divisions of big countries) are to be found in Band 4/5. Any player that is of interest for English clubs in these divisions need extra points.

Those points may come from continental competition (Champions League, Europa League, Conference League). It is worth English clubs keeping a close eye on which teams progress to the group stages and beyond of the main competitions to see which team’s players might become available for a GBE.

As you can see though, the market available to the vast majority of clubs in the UK has been reduced overall. From a situation where the whole EU (27 countries, plus the likes of Switzerland & Norway ~45 leagues of potential Championship talent if including some 2nd/3rd tiers) was full of potential options we now have a situation whereby only eight European leagues are realistic hunting grounds. For Championship clubs that is realistically reduced to Band 2 leagues (Holland, Belgium, Turkey & Portugal) unless targeting fringe players in one of the Big 5 leagues. So that is a reduction of around 80% of potential players in Europe that are available to sign. That’s pretty huge.

You can, of course, go shopping in some new leagues that weren’t as available before. So this does provide an increase in those numbers above. However, as we will see, Championship clubs don’t seem ready to use those markets as this particular moment in time.

The smartest clubs will, of course, have adapted to this situation already. The problem is that when the smart clubs, and then the big clubs, have finished their fishing then the pond is so empty that there is little in the way of quality or value for the remainder. This is precisely why organisation, decisiveness and having a well functioning recruitment system is so important.

How has this affected Championship transfer business?

Firstly, we need to address the issue that Brexit/GBE rules are not the only reason for the reduction in transfer activity that we are about to see. The global pandemic, the reduction of income that has come into clubs, the uncertainty about the future, FFP regulations and ever-increasing wages are all factors that have had a say in the slowing of the transfer market in the EFL in particular.

The data used in the following report comes from Transfermarkt and uses only permanent transfers. No loan deals have been included, either domestic or foreign.

  1. Fewer players being recruited

With two weeks to go until the transfer window closes there is obviously still time to bring these numbers up but there is a definite trend of fewer players coming into Championship clubs. From the nadir of 17/18 where 215 players came into the 24 clubs (average of 8.95 per club) last season this was down at 132 (5.5 per club). At the moment we are at 84 players that have been contracted by clubs in the Championship, an average of 3.5 per club.

2. Much less money being spent on transfer fees

As you would expect, with fewer players being traded this has led to a reduction in the amount of money that is being spent on transfers each season since 17/18.

From a high of over £250m spent in the Championship in 17/18 (£10.6m per club) the amount of money spent has reduced significantly in the post-Brexit, post-COVID era. Albeit we are still discussing a very small sample size (three transfer windows) it seems like a pattern is emerging.

2017/18 was the season of Wolves’ title win, which included a £16m buy of Ruben Neves, but also Middlesbrough bought Britt Assombalonga and Sheffield Wednesday bought Jordan Rhodes for £15m and £10m respectively. There were big fees paid all around the markets. Purchases from League Two that season totalled over £10m, Championship-to-Championship transfers went over £100m, Norwich spent £7m in the 2.Bundesliga, and over £20m was spent on strikers from Ligue 1 (including another £10m from Boro on Martin Braithwaite).

2020/21 saw a total spend of only £70.9m total in the Championship, which equates to £2.95m per club. This is a reduction of 72% from 17/18 and 64% from the previous season 2019/20. The current transfer window is on course for an even lower spend, currently sitting at £27.1m, £12m of which is taken up by the Harry Wilson to Fulham signing alone.

3. Less money spent per player

Combining the two trends together, despite the fact that overall spend is considerably down, the amount of money spent per player is also trending downwards.

The peak of money spent per player was in 2018/19 as clubs spent £1.57m per player. This was the season of Joao Carvalho to Forest for £13.5m, Peter Etebo to Stoke for £6.5m, Lovre Kalinic to Villa for £5.4m, Aden Flint & George Saville to Boro for over £7m each, Bamford to Leeds for £8m, Ryan Woods & Sam Clucas to Stoke for £6m each. These are (generally) fees that even only 3 years later look ridiculously exorbitant.

Season 2020/21 saw a big reduction to £540k per player, at the moment the 2021 summer transfer window has seen clubs spending on average £325k per player in fees. Obviously, this does not take into account wage spend. However, it is clear that many more deals are being done at the end of contracts, either as total freebies or at a much reduced initial fee as a result of players being near the end of their contracts.

4. Increase in percentage of domestic business

One aspect of the Brexit/GBE situation that I wanted to look into was how things had changed within the markets since the GBE requirements had come into play in 2021.

Three-quarters of player moves to the Championship had been domestic across the last few years until the GBE requirements came into play. This current window has so far seen 92% of all player moves within the UK & Ireland. Obviously this is 92% of a much smaller total number of players as we have seen above.

The winter transfer window of 2020/21 was when the GBE rules first came into practice so it is possible to take the business solely from the two transfer windows so far and compare. From 17/18 to Summer 2020, the percentage of player moves that would be classed as domestic was 74%. This has now changed to 91% post GBE rules, an increase of 17%.

So far, however, there has been little change in the proportion of money spent that is going to the domestic market over the foreign market. Yes, it is a much smaller amount either way than in the recent past, but the ratio has yet to change.

However, the business in the 21/22 window so far has been heavily dependent on only two transfer deals, the aforementioned Harry Wilson to Fulham deal and the Martin Payero to Middlesbrough deal. These two transfers practically alone provide the balance you see in the 21/22 figures. We will obviously need to see much more evidence before anything is conclusive.

Again, taking the 2021 windows in isolation: 2021 domestic spend totalled 76% of all business, whereas in the seven transfer windows before that domestic business made up 68%. This is an increase in domestic spend of 8%.

5. Where are the GBE requirements affecting the foreign markets the most?

This is perhaps the most pertinent item as regards to direct effect of GBE requirements on activity. The amount of money spent and the general number of transfers can be attributed to many factors, as outlined above, but this part of the study concentrates upon which areas of foreign markets have seen changes in the amount of business conducted.

As detailed earlier we know that the leagues have been grouped into “Bands”. I was able to classify all transfer activity from 17/18 to now into those Bands to see the effect for each set of leagues, i.e. any transfers that took players from Ligue 1, La Liga, Bundesliga & Serie A would be classed as Band 1.

This graph illustrates how many players have been coming into the Championship from different leagues in the world. The fact is that across all territories is that since GBE requirements came in, only 7 foreign players have been brought into the Championship.

There was a general downward trend in the number of foreign players coming into the league before GBE as well. Looking at players from Band 1 and Band 2 leagues that is quite clear. However, it is also clear that clubs were continuing to look into more obscure markets (Band 4 – Band 6) and numbers of players coming in from those leagues were generally fairly strong in comparison to Band 1 and Band 2. Since GBE those Bands have been abandoned as it is almost impossible to bring in players from those leagues now.

It is still possible to bring in players from Band 3. However, as can be seen in the graph, these are territories that Championship clubs have never used and lack the knowledge and infrastructure at the moment to use those markets effectively. Yohan Mollo (Russia), Martin Payero (Argentina), Samba Sow (Russia) & Felipe Araruna (Brazil) are the only players to come in from Band 3 leagues to the Championship over the sample size.

Moving away from the players into the actual spending figures it is again interesting to see the amount of money that had been spent by Championship clubs in different areas. The players brought in from Band 1 and Band 2 (Holland, Belgium, Portugal, Turkey) came to quite a lot of money between 2017-2020. However, since 2020 the spend in those leagues has been minor or non-existant.

I find this fascinating because, technically, within the GBE rules these players are still available to the Championship clubs. This suggests that either the GBE rules are not the main reason so reduced spending, or that the bigger or smarter clubs are concentrating their own operations in the Band 1 and Band 2 leagues and keeping the Championship clubs frozen out of the better players and better deals. More evidence is required to find out exactly what is going on with it though.

The big disappointment for Championship clubs is clearly the Band 4 situation. In 2019/20 Championship clubs spent over £25 million in those leagues that are practically out of range now, unless some of the clubs progress well in European competition. Players brought in included the likes of Croatian League’s Ivan Sunjic (£7m to Birmingham) and Simon Sluga (£1.5m to Luton) and Ligue 2’s Bryan Mbuemo (£5.5m to Brentford) and Brice Samba (£1.75m to Forest). All of the investment that Championship clubs had clearly been putting into these interesting markets was coming to fruition and has now been snubbed on the whole.

Even Band 5 leagues were seeing a lot more activity in terms of money. In 20/21 over £10m was spent in those markets that are definitely now out of reach, except in exceptional circumstances. £7m of that money came from investment in the Polish Ekstraklasa in the shape of Kamil Jozwiak (£3.75m to Derby), Premyslaw Placheta (£2.7m to Norwich) and Michal Helik (£700k to Barnsley). It is difficult to see where investment in these leagues will come from now, a shame for operations who smartly identified talent early.

Finally, I will just display some pie charts that represent where the players have come from that have been transferred in by Championship clubs over the last five seasons. It works as a summation of what has been discussed above.

What next?

I will produce updates on this topic at the end of the transfer window to see how it shapes up after deadline day. It is fascinating to see the changing landscape in the division. There seems to be just as much money in the game as ever in the Premier League, but the tightening of the purse strings in the Championship cannot be denied. There is a definite change of tactics in the division around recruitment and a comparison between incomings and outgoings appears to be a good idea for an investigation. The way that Brentford have been able to scale up their operations on the back of smart player trading appears to have stimulated this change, as well as, perhaps, FFP restrictions.

There is certainly much to investigate and learn from in these figures. For those who wish to see the raw data I will dump the tables that the above charts came from as an appendix below.

Appendix – Transfer Data

SeasonPlayers InTotal SpentMoney Spent per PlayerDomestic Players% of total players from domestic dealsDomestic Spend% of total spend that is domesticBand 1 PlayersBand 1 SpendBand 2 PlayersBand 2 SpendBand 3 PlayersBand 3 SpendBand 4 PlayersBand 4 SpendBand 5 PlayersBand 5 SpendBand 6 PlayersBand 6 Spend
17/182152550940001186483.72115271%16460600065%1828220000143637000010171733000033240000105328000
18/191412035300001443475.17711481%15698500077%7108000005278100000011788000030155000
19/201611962670001219049.68911873%12661700065%10358200005390000026300001927230000118000006270000
20/2113270963000537598.484810076%4939000070%5450000031800000009324000081059300071440000
21/228427120000322857.14297792%1924000071%004180000016080000000020
Post GBE12432316000260612.903211391%2443600076%004180000016080000100050
17/18Number of Players InAmount Spent
Premier League2737560000
Championship59100490000
League One329610000
League Two1210260000
National League4558000
Scot PL105660000
Scot CH1306000
Scot L110
Ireland6162000
Domestic152164606000
Ligue 1923670000
Bundesliga3450000
La Liga20
Serie A44100000
Band 11828220000
Eredivisie65580000
Belgium44770000
Turkey11030000
Portugal324990000
Band 21436370000
Band 310
Band 41717330000
Band 533240000
Band 6105328000
Total215255094000
18/19Number of Players InAmount Spent
Premier League2359790000
Championship4266060000
League One3621220000
League Two62500000
National League10
Scot PL47100000
Scot CH00
Ireland1315000
N.Ireland10
Domestic114156985000
Ligue 137830000
Bundesliga11350000
La Liga21350000
Serie A1270000
Band 1710800000
Eredivisie1360000
Belgium15400000
Turkey00
Portugal322050000
Band 2527810000
Band 300
Band 4117880000
Band 530
Band 6155000
Total141203530000
19/20Number of Players InAmount Spent
Premier League2450360000
Championship4860310000
League One3113290000
League Two8923000
National League1104000
Scot PL51630000
Scot CH0 
Ireland1 
N.Ireland  
Domestic118126617000
Ligue 1320250000
Bundesliga0 
La Liga33870000
Serie A411700000
Band 11035820000
Eredivisie33900000
Belgium1 
Turkey0 
Portugal1 
Band 253900000
Band 32630000
Band 41927230000
Band 511800000
Band 66270000
Total161196267000
20/21Number of Players InAmount Spent
Premier League1516170000
Championship3510780000
League One3615490000
League Two40
National League10
Scot PL76950000
Scot CH10
Ireland10
N.Ireland00
Domestic10049390000
Ligue 114500000
Bundesliga00
La Liga10
Serie A30
Band 154500000
Eredivisie21350000
Belgium1450000
Turkey00
Portugal0 
Band 231800000
Band 300
Band 493240000
Band 5810593000
Band 671440000
Total13270963000
21/22Number of Players InAmount Spent
Premier League1114180000
Championship313240000
League One261820000
League Two30
National League2 
Scot PL2 
Scot CH10
Ireland 0
N.Ireland10
Domestic7719240000
Ligue 1  
Bundesliga  
La Liga  
Serie A  
Band 1  
Eredivisie11800000
Belgium3 
Turkey  
Portugal  
Band 241800000
Band 316080000
Band 4  
Band 5  
Band 62 
Total8427120000
Post BrexitNumber of Players InAmount Spent
Premier League1414180000
Championship413956000
League One394270000
League Two60
National League3 
Scot PL72030000
Scot CH10
Ireland10
N.Ireland10
Domestic11324436000
Ligue 1  
Bundesliga  
La Liga  
Serie A  
Band 1  
Eredivisie11800000
Belgium3 
Turkey  
Portugal  
Band 241800000
Band 316080000
Band 41 
Band 5  
Band 65 
Total12432316000

Recruitment In Football: Trying To Continually Make The Smartest Decisions

I keep being asked, mainly within Blackburn Rovers circles, about recruitment. I mean, I would hope so in a way seeing as I put hundreds of hours into those documents in the last two seasons. However, I also haven’t written anything for quite some time and I just fancied getting some of my thoughts down on paper.

So this does apply to Blackburn Rovers, and some bits directly so, but moreover, this is kind of a manifesto about how I see recruitment in the modern football world. I only have certain amount of experience within the football recruitment world but it’s my take and it’s just an opinion. I would just like to think that it makes a lot of common sense, happy to be proven wrong.

Tony Mowbray talks every transfer window about “making the group stronger than when we enter it”. Whilst this is a noble aim and on the face of it that makes a lot of sense, it is actually quite a) difficult, b) potentially counter-productive and c) setting yourself up for problems.

As I type Danny Ings has just left Southampton for Aston Villa in a reported £30m deal. This in turn has seemingly increased the likelihood of Saints returning for Blackburn’s Adam Armstrong. Sitting in a position at the moment where there have been literally zero incomings in the summer window so far and with the prospect of losing Armstrong can anyone say anything other than the group is anything but weaker.

However, this is an isolated, and relatively extreme example. My overall point is that taking recruitment window by window in general is something that I would consider to be a poor overall strategy. When you are operating within a strict budget it is so important that as many decisions as possible are “correct” so the overall process needs to be smooth and pointed towards the goal. This way money isn’t wasted in areas that are unnecessary and gives the whole process the best chance of success.

The ideal process

Most, if not all, head coaches and their leadership teams have a game model that they want to see on the pitch. Even if that is not constant match-by-match as specific tactics will take their effect, there is still a specific plan for future progress.

For the plan to work the coach requires specific tools to carry out the job. The players within the squad need to be capable of carrying out the instructions correctly so it is imperative that the playing squad is maximised to give the coach the best chance of success.

I personally plan out what the perfect squad would be for the game model. The table below is my interpretation of how I felt that Tony Mowbray would like to have a Blackburn Rovers squad based upon what I think is his ideal game model.

PositionRole DefinitionExperience profileWage commitment
GK1Sweeper KeeperHigh6
GK2Sweeper KeeperLow0.5
RB1Wing backAny6
RB2Full backAny1.5
CD1StopperHigh7
CD2Ball playing defenderHigh6
CD3StopperAny2
CD4LCBLow0.5
LB1Wing backAny6
LB2Full backAny1.5
DM1Ball winnerHigh5
DM2RegistaLow0.5
DM3Ball winnerAny2.5
CM1Deep lying playmakerAny6
CM2RunnerAny6
CM3TempoLow1.5
AM1Progressive runs/dribblesAny6
AM2Progressive pass/creatorLow2.5
RW1Dribbling wingerAny5
RW2Inside forwardLow2
LW1Wide target manAny5
LW2Direct goalscorerLow2
CF1Advanced forwardAny9
CF2Deep lying forward/F9Any5
F1Power forwardHigh5
100

I have also included a reference towards balance of experience and also the percentage of the wage allocated to the position. This is probably a little bit of overkill as it will never quite pay off but I still believe it is important to have a plan for it, that way you know where you may be overspending in comparison to importance to the squad.

Now that you have your ideal squad it is a case of populating it. Obviously you are already working with a group of players so the first job is to work out how many of those roles are filled or could be filled from players contracted to the club already. You may also be able to identify key players to target for new contracts through this process or, indeed, players that don’t fit the model at all or are paid way over the amount that you would want to allocate to the specific role. These are all just as important as bringing in new players.

Once it has been decided to bring players in then it is all about maximising value. The roles have been set out and if it can be agreed how those roles are made up then you can be very targeted with the players you’re looking at. At this point, because of the recent Brexit rules it should be mentioned that the pool of available players coming into the UK (especially for Championship & EFL clubs) has been quite significantly reduced (a subject for a future piece of writing) and therefore it should be possible for a well-run department to be across practically every player that is possible to bring in to the club.

This is why the criteria being used is so important. I personally have a list of attributes that make up the roles detailed above. I have provided an example below:

Position & technical attributes

I can then use these attributes as measured across real-life performances and monitor players all across domestic and foreign territories looking for those players performing well in those specific attributes.

I use Wyscout as my data provider and therefore, taking the example of the power forward above I have matched up my attribute statements with a mixture of Wyscout searchable data points and then also attributing the importance of visual scouting as well.

I have done that If these players can be monitored and identified on a constant basis then greater scouting work can then be done well ahead of time, i.e. when the players become available (out of contract) or one year before their contract ends. You are still limited by the data provider(s) that you use but if you are able to marry the data provider to the attributes you have identified then you are at least using the provider that you are paying for to the maximum value. I don’t have access to x.y data or tracking data at the moment and that is one aspect of identifying players that is absolutely key.

My final point is this, despite my prevalence towards the use of data in recruitment there is no way that a player should be signed without thoroughly observing their play either via video or in real life, preferably all routes should be explored. All that I am advocating here is that a detailed data farming procedure is employed in order to targets that may otherwise be missed. Identification, observation, live scouting and then negotiation is the ideal route.

This isn’t about analysis, it’s about heart & soul

It’s a mixture of New Year perspective, overtiredness and genuine social concern that fuels this rambling this morning. I just want to touch on a few things that are occupying my mind around football at the moment.

As an analyst/technical scout its really my job to focus on the data, the numbers that explain how and why things happen & what that should mean in the grand scheme of things. However, I think that it is so important that we allow ourselves to consider football in its more emotional and unpredictable form.

I know that writers/podcasters/analysts in the Twittersphere are of course lovers of the game. None of us would profess to know all there is about what goes on in the football world. So it is important that the tone of our work reflects that. I’m sure many accounts that focus more on their own club find brick walls sometimes when fellow fans just do not, cannot and will not understand, or even want to engage, with your well-reasoned and data-backed explanation of why that 3-1 loss to a rival wasn’t, in fact, “a pile of steaming horse shit”.

But, that’s totally fine isn’t it? We love being the ones to bring this information out there, but football fans will consume the game the way they want to. If a data sceptic somehow wanders into my work and starts to pull it apart I’m not going to get involved in a slanging match about it.

Just like the rest of life, the game of football is all about opinions, and that is why we love it so. I just wish that the way the interaction of opinions takes place cut a more civilised tone sometimes.

We have seen this week that an opinion aired live on TV can generate a huge incident. Karen Carney has currently felt the need to remove herself from Twitter, seemingly as a direct result to the messages received from Leeds fans following her punditry on the West Brom vs Leeds match.

My personal opinion is that the words that Carney used in her answer were probably not the ones she intended to use. Having done a lot of live streams & recordings I know that not everything comes out perfectly. Carney was trying to make a point about how Bielsa teams have a reputation for burning out towards the end of a season. There is some data evidence that would back up that opinion, some of which came in Leeds’ 18/19 season under the Argentine. However, stating that “Leeds were promoted because of COVID” was not, I would guess, exactly how Carney wanted to frame that.

That doesn’t mean that her general point was “wrong”. Yes, I can understand Leeds feeling slightly annoyed about a statement like that, but for the club official account to come out and bring it into light is a tacit invitation for all Leeds fans to take up arms. The owner thought it was fine too. The subsequent blow-up over it just demonstrates my point of football being an emotional behemoth that requires a little bit more understanding if we can manage it.

My wife is a mental health training deliverer for MIND. She picked up on the Carney story through her social media and trust me, she doesn’t give two hoots about football. So it shows the power of the sport, and of social media, in getting messages out there.

If we can then we need to ensure that as many of those messages portray the sport in a positive light. We love this game. It has the power to uplift, shock, delight, thrill and unite.

We have lost so much in the last year. I worry that some things will never return at all. I want to see people’s smiles, I want to walk into a bar and stand at that bar holding my drink and chat to the staff. I even want to go into the office, sometimes. But who knows at the end of all this uncertainty, what really will return to pre-COVID social rules.

Going to a game of football. Seeing your mates. Hugging total strangers. Having a shouting match with the opposing fans. These are the experiences that put football in our souls. As much as I love to calculate xG values and discuss passing lanes, half-spaces and marginal gains, it is my heart & soul that brought me to this sport. That is what gave me life and direction when I got made unemployed. Even if now no-one read or liked or commented on this, or any future piece of my work it’ll all be fine.

Because football doesn’t need me. It doesn’t *need* any of “our” analysis. It is there for the fans and we love it and live it and we need it. But if it could just be that 1% more sympathetic then that is a marginal gain I could throw myself behind.

Design a site like this with WordPress.com
Get started